[Lee, Daniel]
Lee has updated the model of bulk acoustic wave noise in GWINC (I believe to account more accurately for shear modes), but the results seem to indicate more bulk acoustic wave noise than the Holometer measured or I have modeled with COMSOL. Attached are 4 figures. The first is the measured Holometer data (fig 12.) The second is a plot from the GWINC model of the Holometer. The differences between the GQuEST model and Holometer model are arm length, laser wavelength, arm power, mirror size, mirror material, and mirror spot size. The Holometer end mirrors were modeled as 0.5" thick, 1" radius and the beamsplitter as 0.5" thick, 1.5" radius. Both were made from fused silica at 294 K. The beam size on the end mirrors is 5 mm. The calculated noise in GWINC is a maybe bit higher in this model, but it is fairly close.
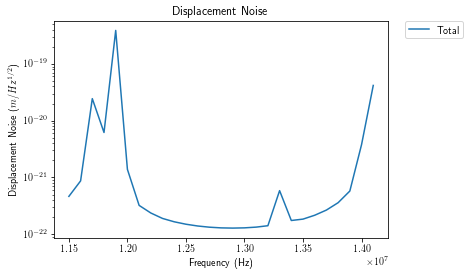
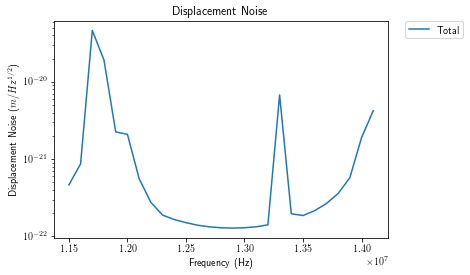
I also did 2 COMSOL simulations with a 2 mm thick, 12 mm side length mirror with a beam waist of 2 mm with 1e6 Q Silicon. Both simulations had 14 mesh layers in the beam axis. For the first simulation, there were 42 mesh layers on each transverse side. For the second simulation, there were 84 mesh layers on each transverse side (making the mesh elements cubes). The minimum value of the graphs is nearly identical. Comparing the peaks is less meaningful because of aliasing due to the course frequency sampling of 100 kHz. The fact that the minima are so close implies that previous COMSOL simulations, which showed minimal noise from shear modes outside of certain peaks, were not limited by the transverse mesh density. Lee points out that the Krylov-space inversion solver might drop modes since it is a reduced-order solver. I am therefore running an eigenmode solver right now.
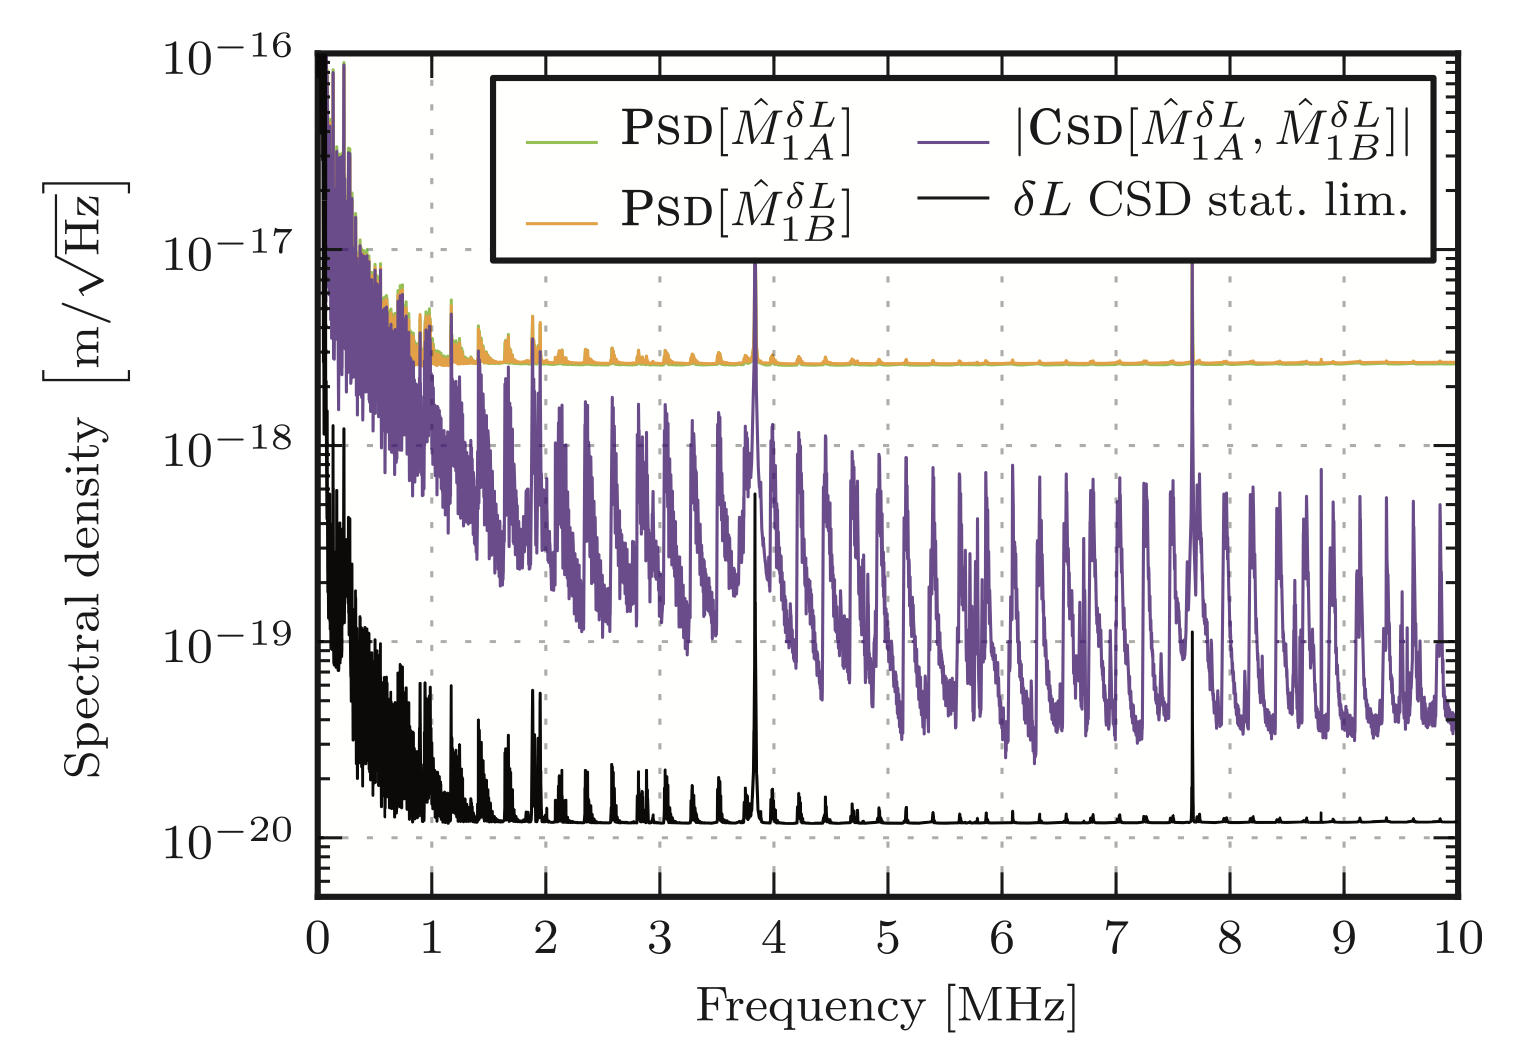

Shown is an overlay of the GWINC model (orange) and the data (purple) for the Holometer. Around 1.8 MHz, the GWINC seems to not bottom out as low as the data. This 7th bin is GQuEST's peak signal frequency. At high frequencies, the GWINC model bottoms out more. I think this is due to coating thermal noise setting a higher noise floor in the Holometer data.