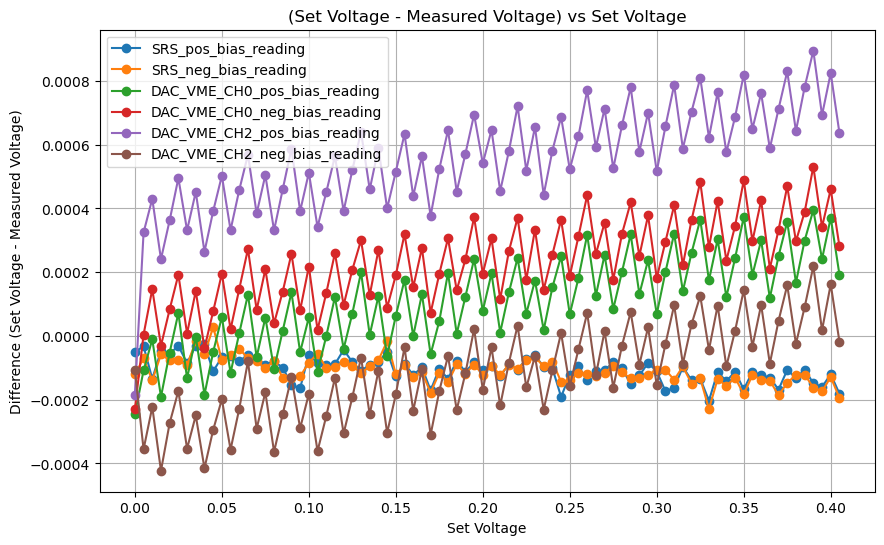
I have continued my testing of the voltage sources we have for the SNSPD's, including the new DAC VME. I have below some data that was taken using the SRS voltmeter as a dedicated measuring device. I then stepped through various voltages within the range we will be using the source for the SNSPD's to read out the measured output vs the set voltage. To better see the minute changes of each source, I then subtracted the "set voltage" from the reading and plotted the difference vs the set voltage shown below. The variations are small, but it is clear that the filtered channel has some extra amount of variation between the set voltage and what is being output.
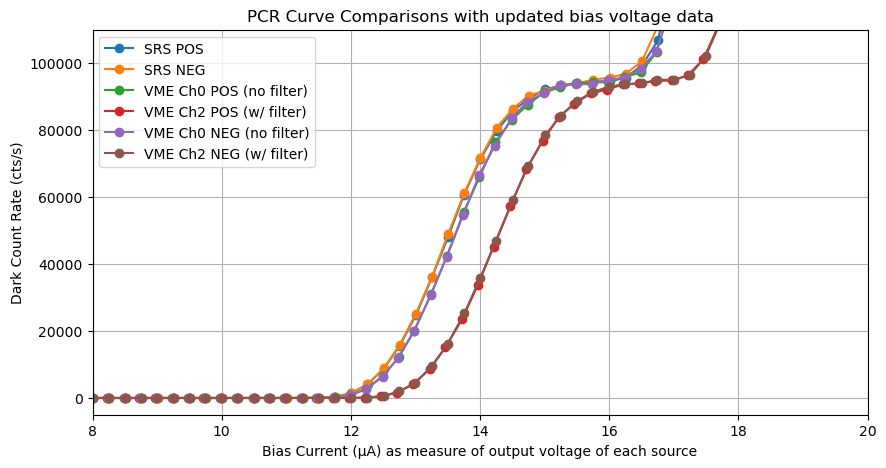
In my previous post I showed a plot that has PCR tests for each of the voltage sources. The filtered channels (ch 2) seemed to have a shift to the right indicating that the voltage source may be outputting less voltage respective to what is being set to. To test if this may be the case, I replotted this PCR chart using the measured voltages for each step of data that was taken. The results still show that the filtered DAC channel continues to have a shift, which we believe may be due to some type of voltage division happening with the lowpass filter on its output. For the time being, we will be utilizing the new DAC VME but on channels without these filters as they seem align well with the SRS source, while we are aware of the obvious aliasing occuring on its ramped output due to its digital nature. (see plots below)