[Torrey, Ian]
We had attempted to make a cavity ringdown measurement in the past unsuccessfully (never posted on the log). Here we show a successful measurement. Key difference to past attempts were the TRANS pd we originally used were low bandwidth (BW<550kHz) where the time scales being measured are on the order of megahertz. Previously we also used the FSR of the 1550 light instead of the 775 light, which is just a factor of 2.
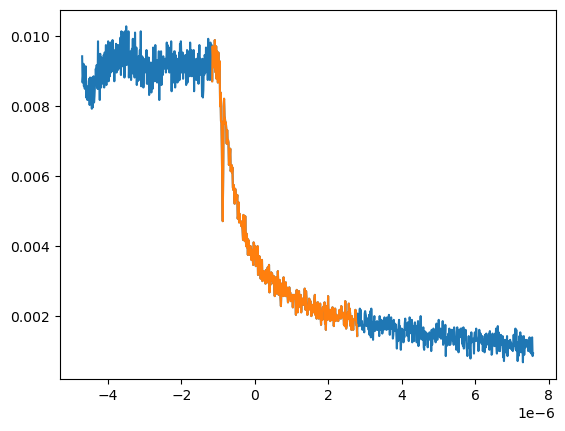
Here is the new attempt. Changed the measurement PD to the 1811 REFL PD to DC coupling and adjust error signal set point and PID controller so that you can lock the cavity with the much higher bandwidth PD on DC coupling (DC coupling the PD reduces the error amplitude). We lock the cavity with the 775 light using this method and then change the trigger mode on the moku to decaying edge and set the threshold underneath the lock point. We then use the AOM as a "fast shutter" of the light going to the cavity simply by turning off the amplified RF drive going to the AOM. This should be a sufficiently fast "blocking" of the light going to the filter cavity. We see a decay.png in the cavity by doing this. I then wrote a quick script to fit a decaying exponential to the data and calculate the finesse from this where the finesse will be F = 2*pi*FSR*tau = 2*pi*(3e8/2.4)/2*tau (from here tau * cavity bandwidth = 1/(2*pi)).
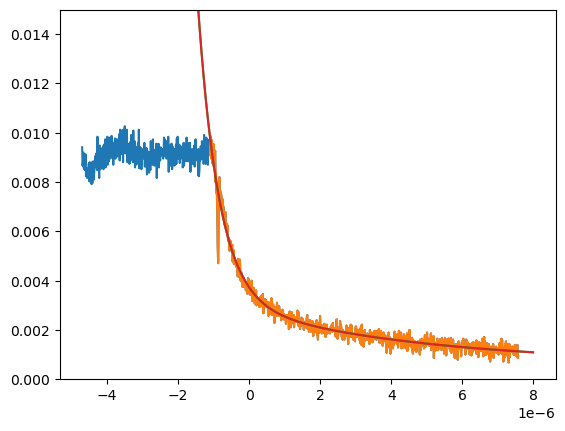
How good the fit is depends largly on the portion of the data used, where the tailing end of it does not seem to be exponential. For example:
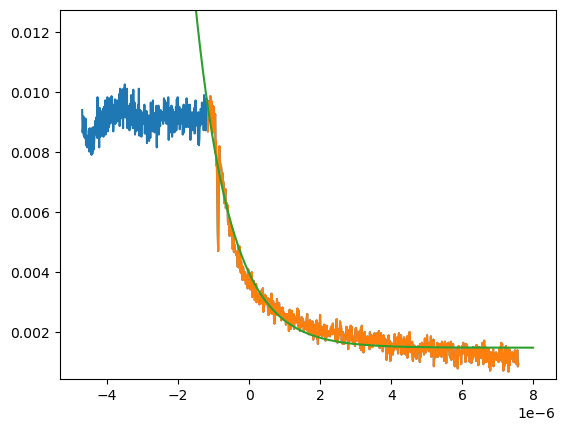
If we use this much of the data decay-overlay.png, the fit looks like decay-fit.png (decay-overlay.png). This yields a finesse of 389.
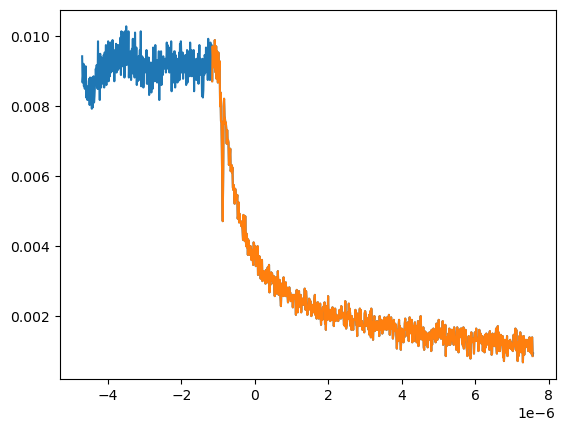
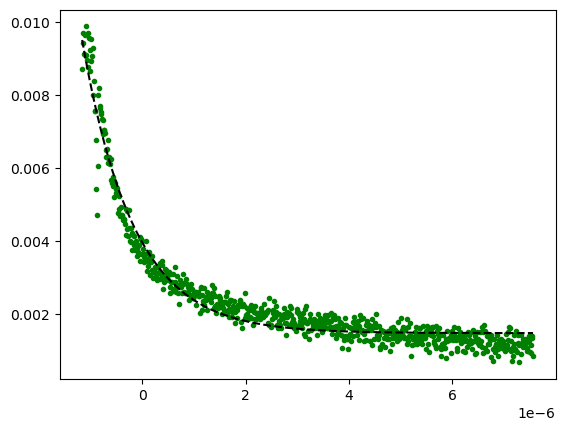
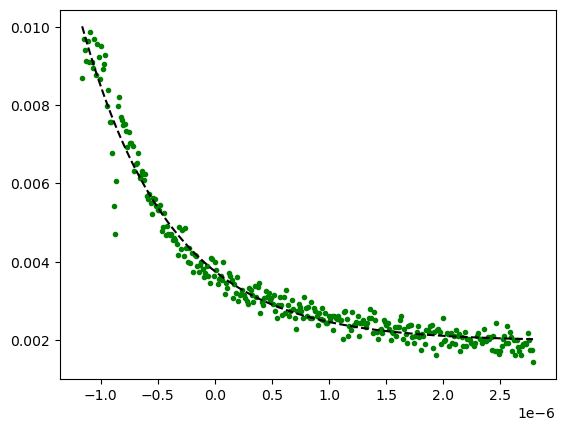
If we use only the portion of the data that looks like an exponential (the end of it looks linear,not sure why) decay-data-used2.png, the fit is much better decay-fit2.png/decay-overlay2.png and we get a finesse of 303.
The finesse should be 313, see post [11633], based on the reflectivities of the mirrors. Further analysis is needed but I think we can constrain the measured finesse to between 389-303.
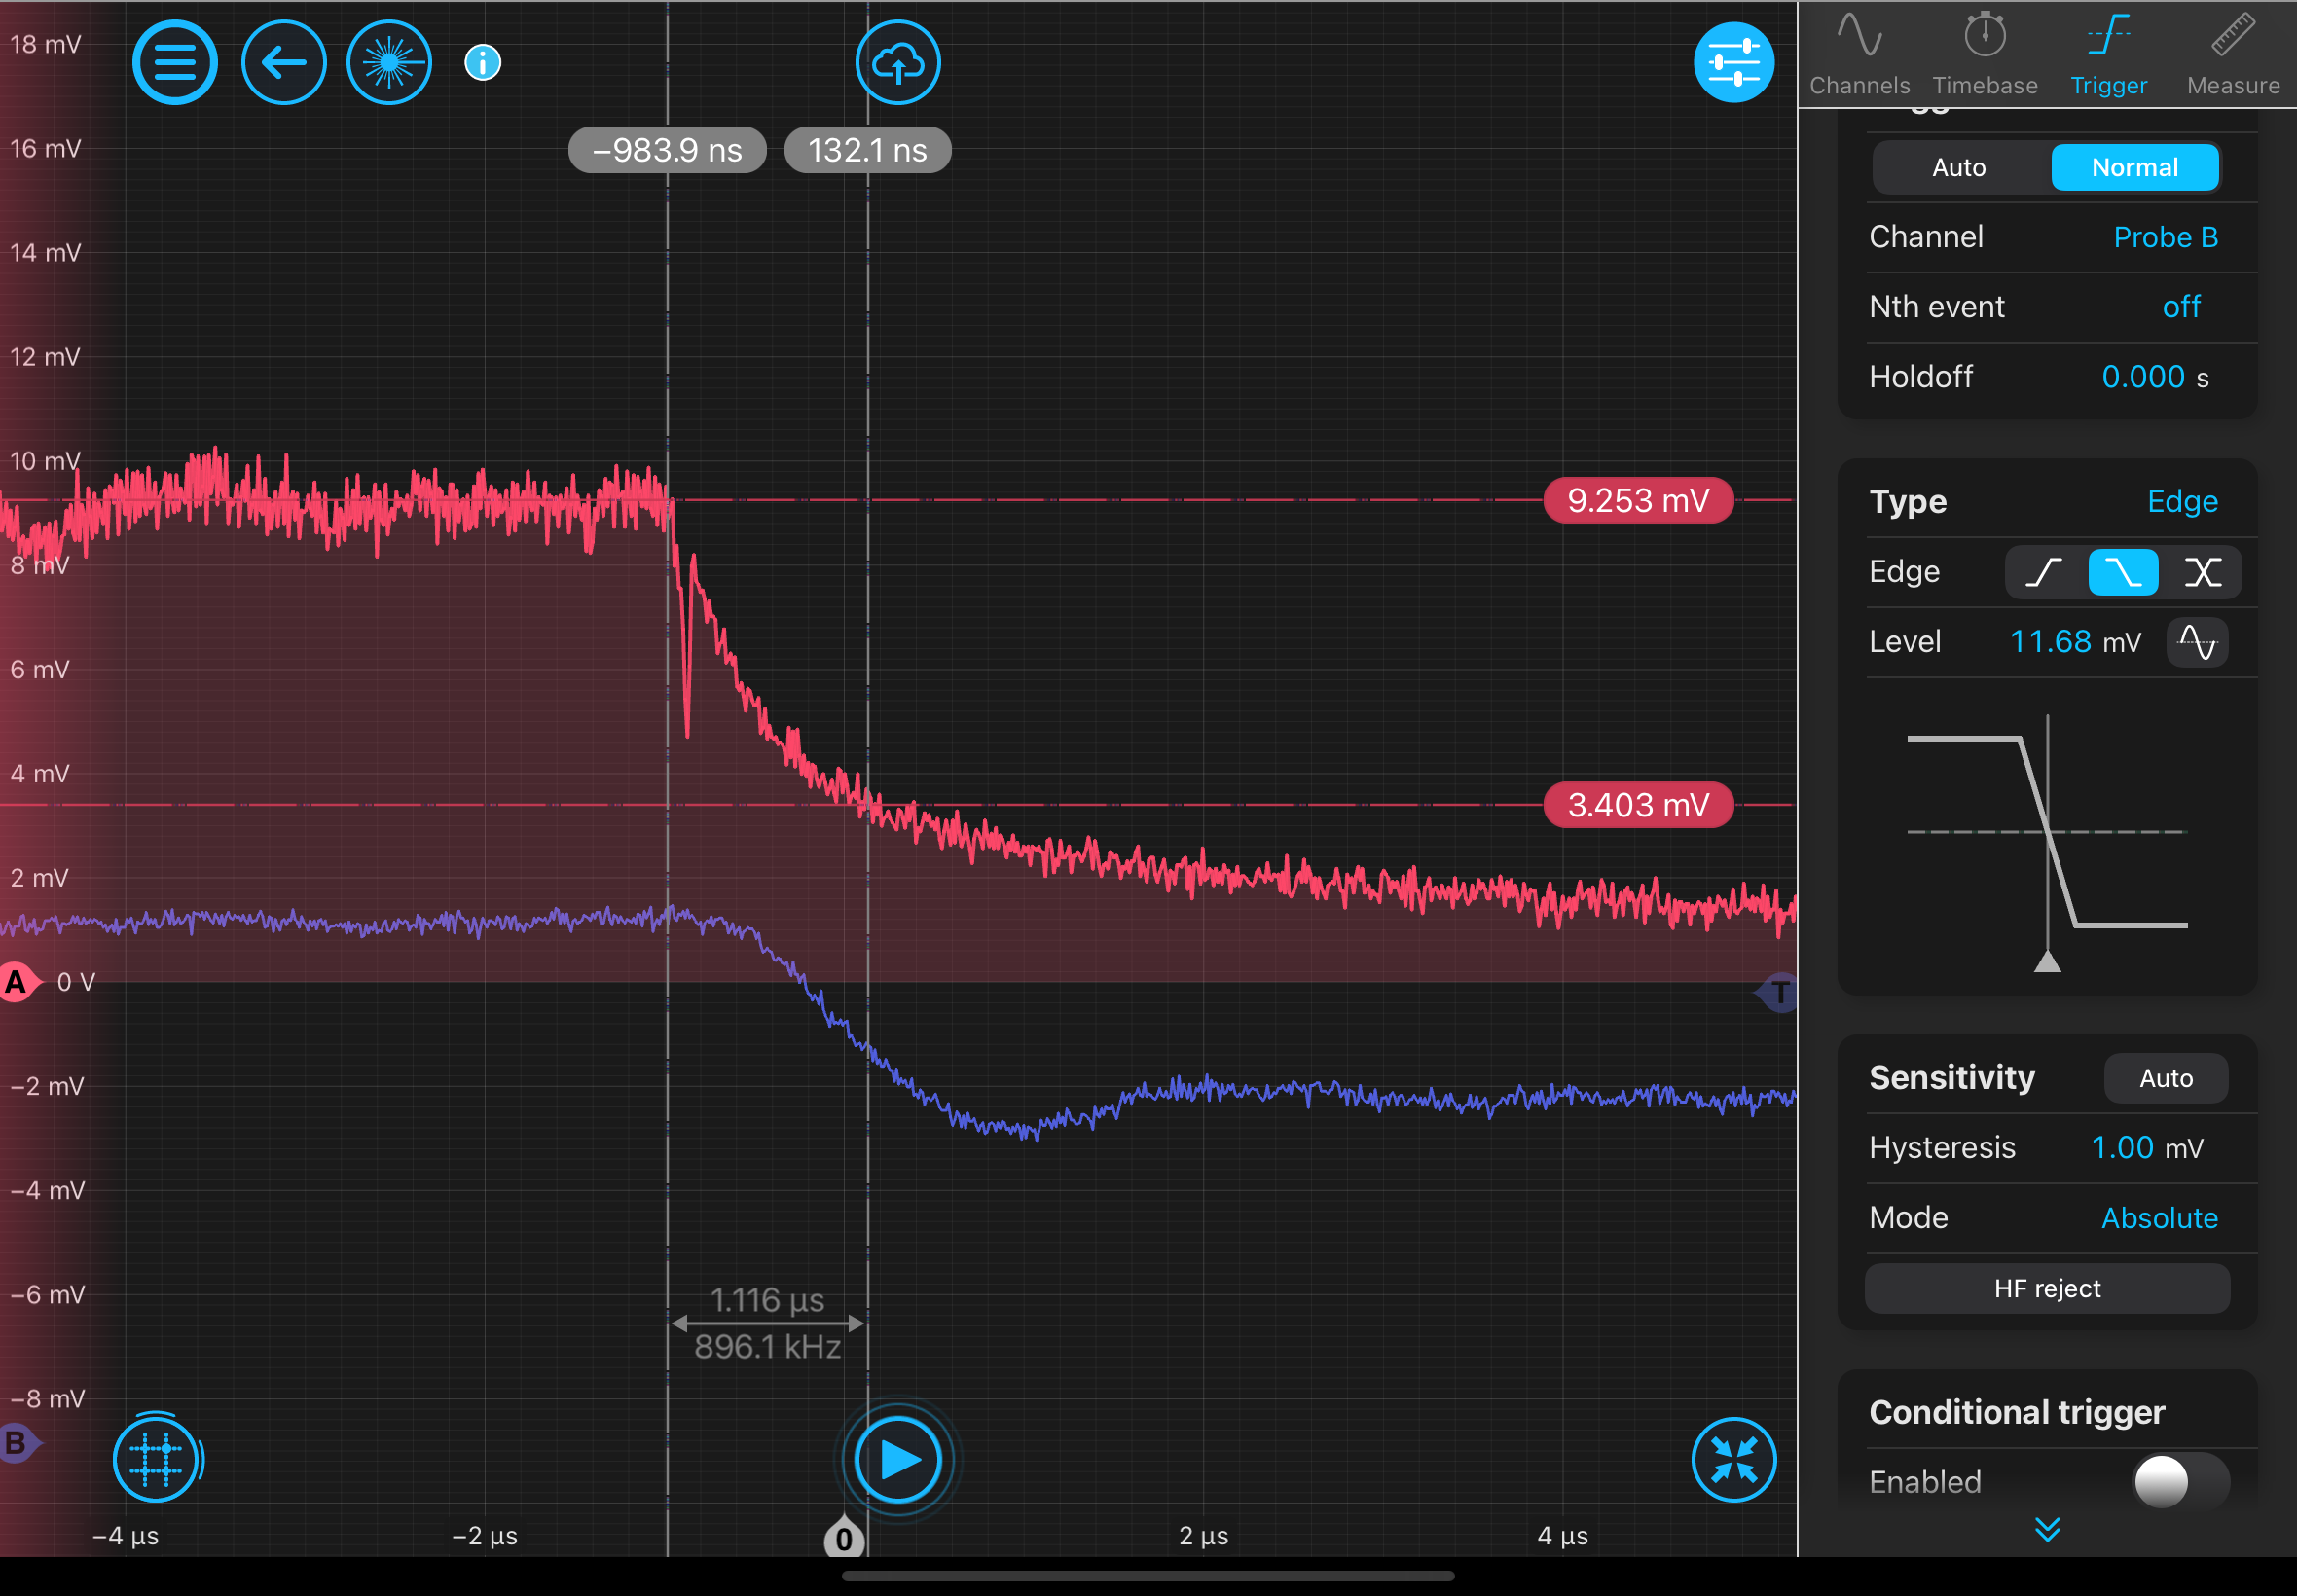
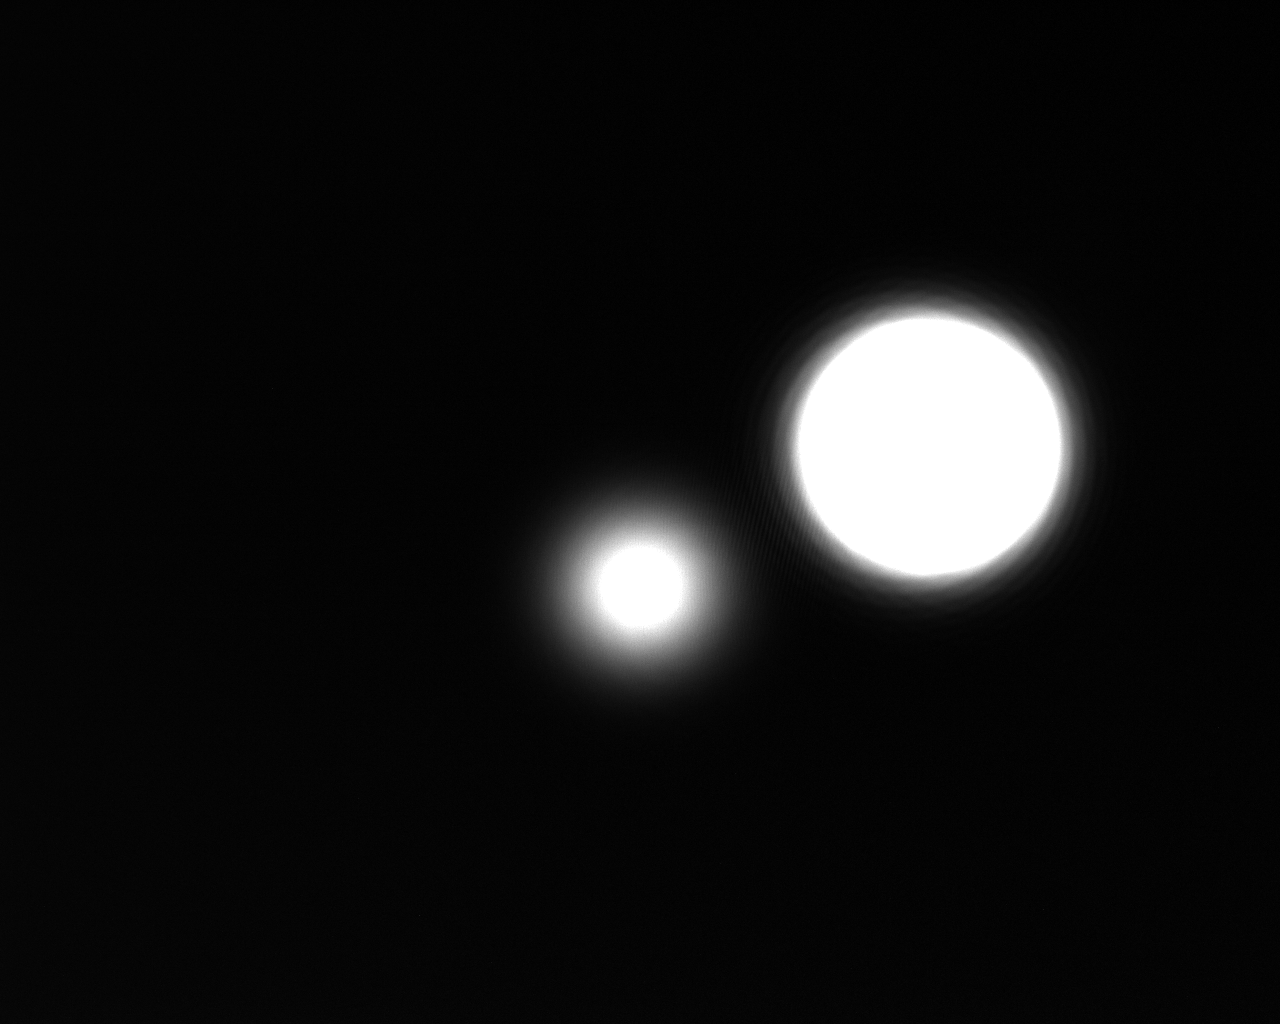
A potential source of error in this measurement could be the fact that the 775 light has a ghost beam, see attached.
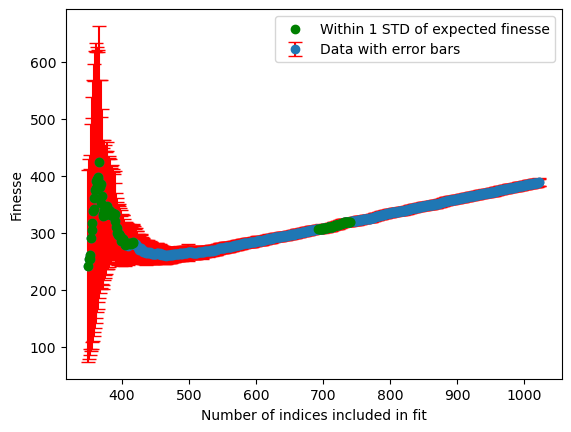
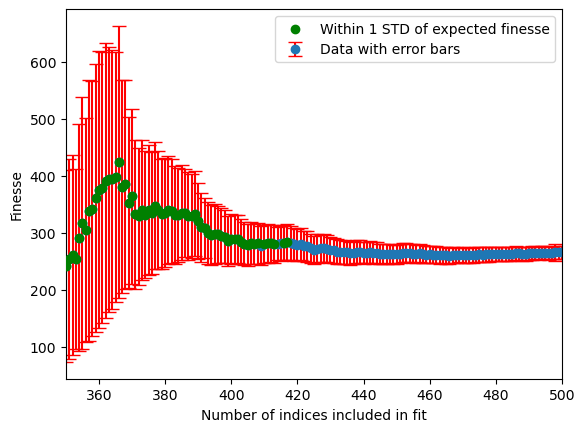
I think Sander asked in the meeting about how the number indices used in the fit effects the value/standard deviation of the calculated finesse. Attached is the finesse according to this ringdown as a function of number of indices used in curve fit, as well as error bars with +/- 1 standard deviation ( finesse_indice_cutoff_full_view.png and finesse_indice_cutoff.png). Green points have our expected finesse within 1 standard deviation, as calculated from the reflectivities of the mirror. Not sure how accurate a data point where the finesse falls in the bottom half of +/- 1 std is as we should never expect to accidentally have better mirrors than the manufacturers measured specs.
The average of all green points is 306 compared to the expected value of 313.
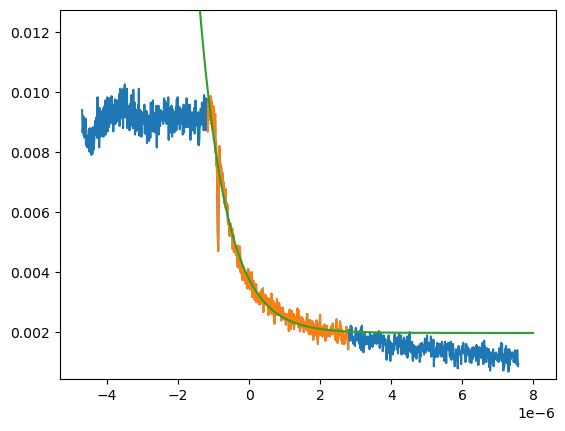
There was also talk of the end of these points potentially decaying by an extra factor. I think this is confirmed in second_exponential_in_data.png, as the green curve fits very well to the tail end of this data. This also looks like whatever is causing the points making up the green fit are becoming the dominant factor around t = 0.
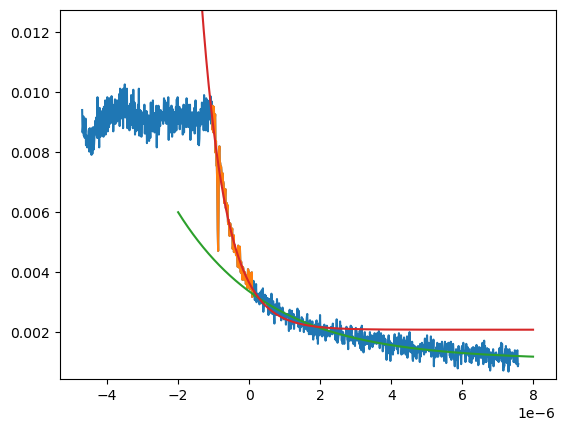
Fitting the decay measurement to a sum of exponential curves with different time constants yields a very good fit. It seems there is an additional decay process in this measurement, most likely electronic.