David Nguyen - posted 09:24, Tuesday 02 July 2024 (11700)
Magnitude Bode Plot Slopes Follow Up
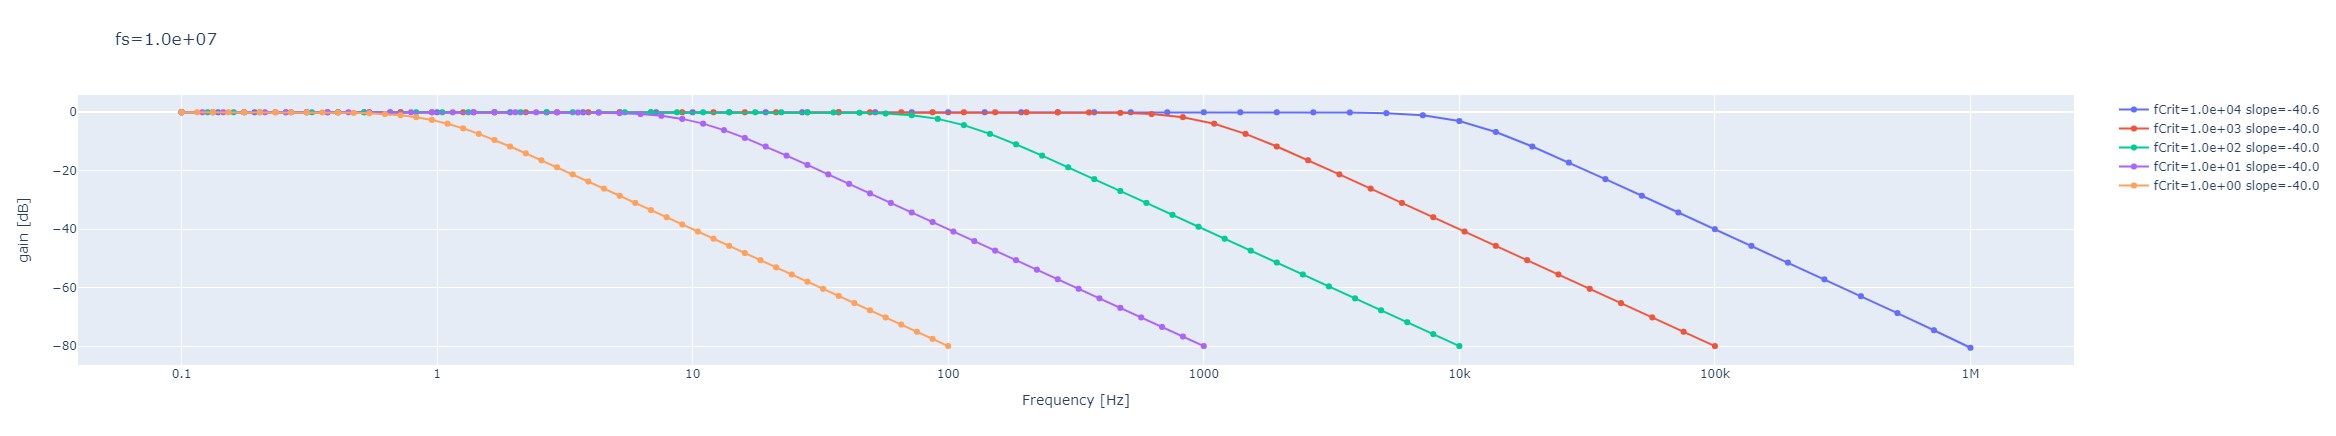
The first plot I attached is a logarithmically scaled gain plot for a lowpass filter with corresponding slopes for different critical frequencies. As we see, the filters retain the -40dB/decade slope as expected, and I speculate that the incorrect slopes from my previous post resulted from sampling points too close to the critical frequency.
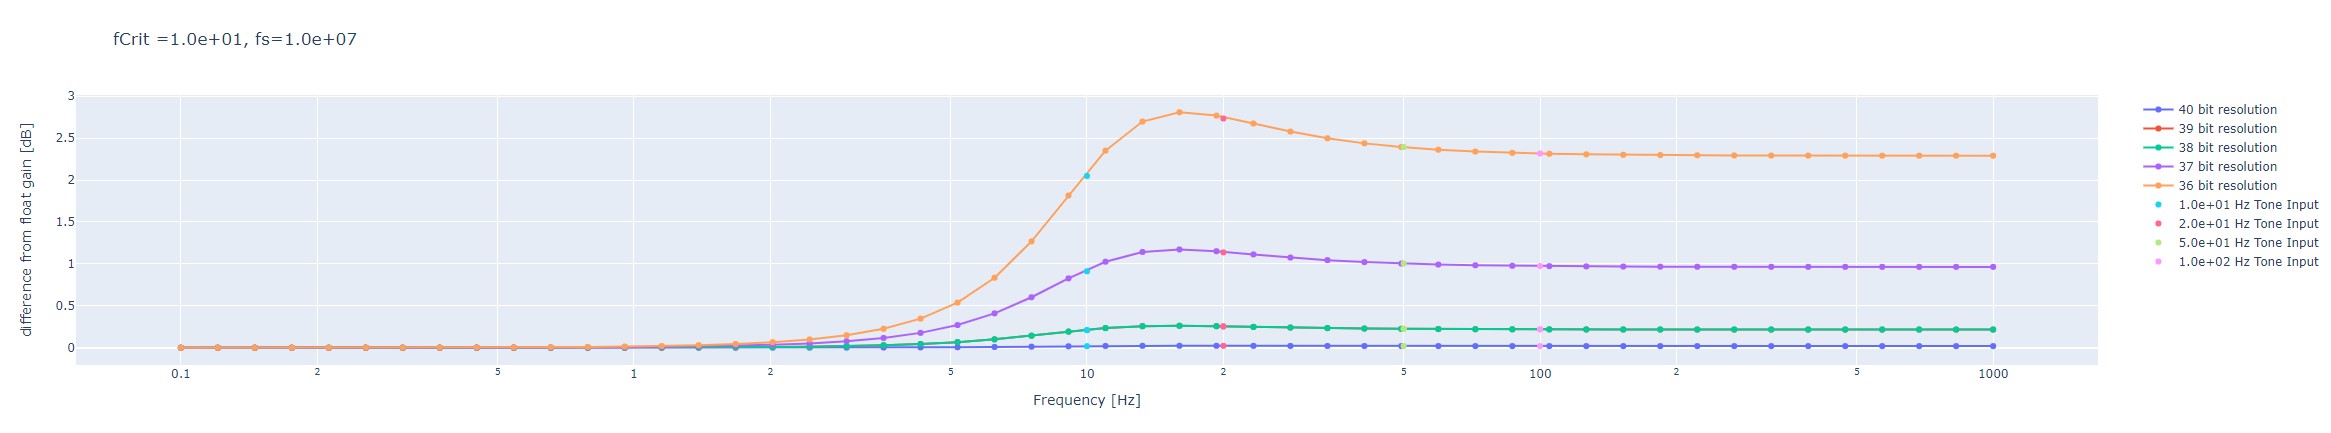
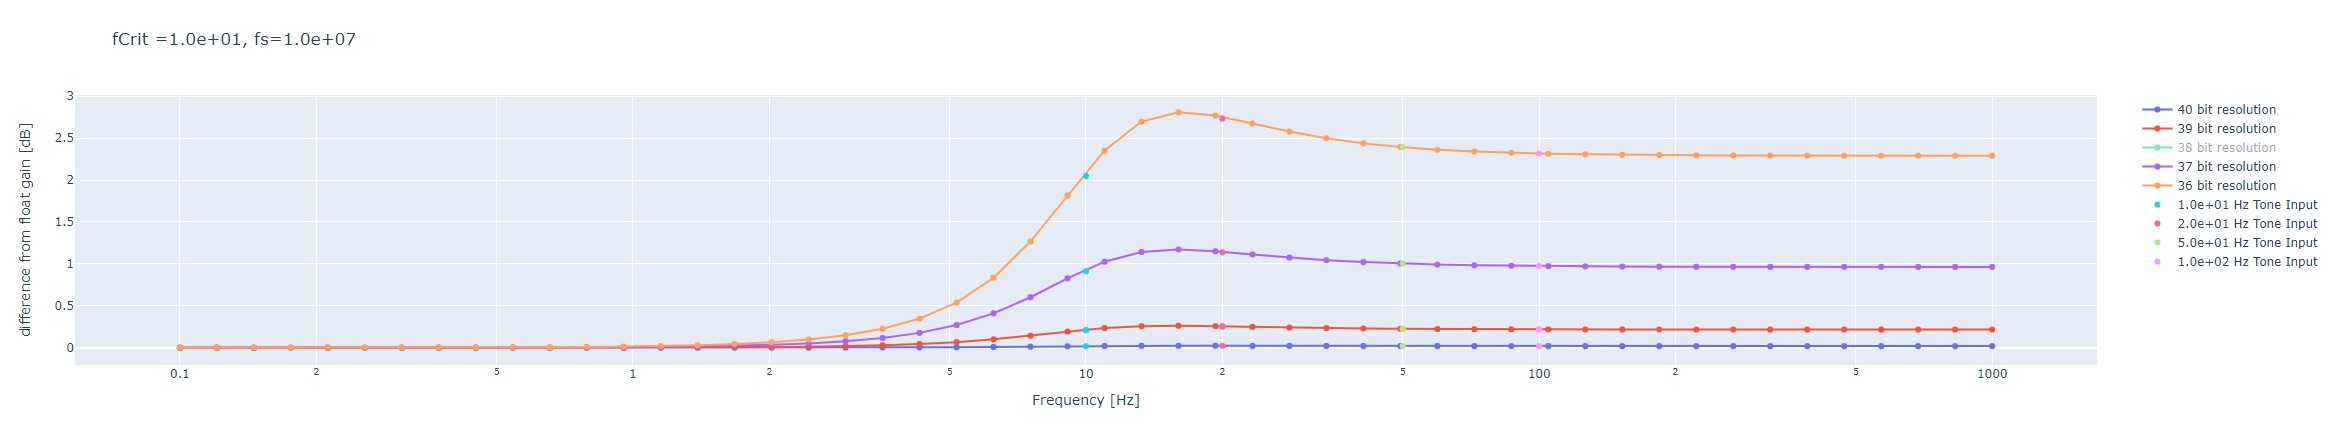
The second (and third) plot is a gain difference plot between the float filter and lower bit resolution filters. I have also included selected points for verification of these differences. They result from manually inputting tones into the filters and finding the gain using the Welch method. The third plot has the 38 bit resolution toggled off to show that 38 bits produces the same precision as 39.
My next post should be about how differing bit resolution affects digitization noise.
Images attached to this report