[Briana, Ian, Torrey]
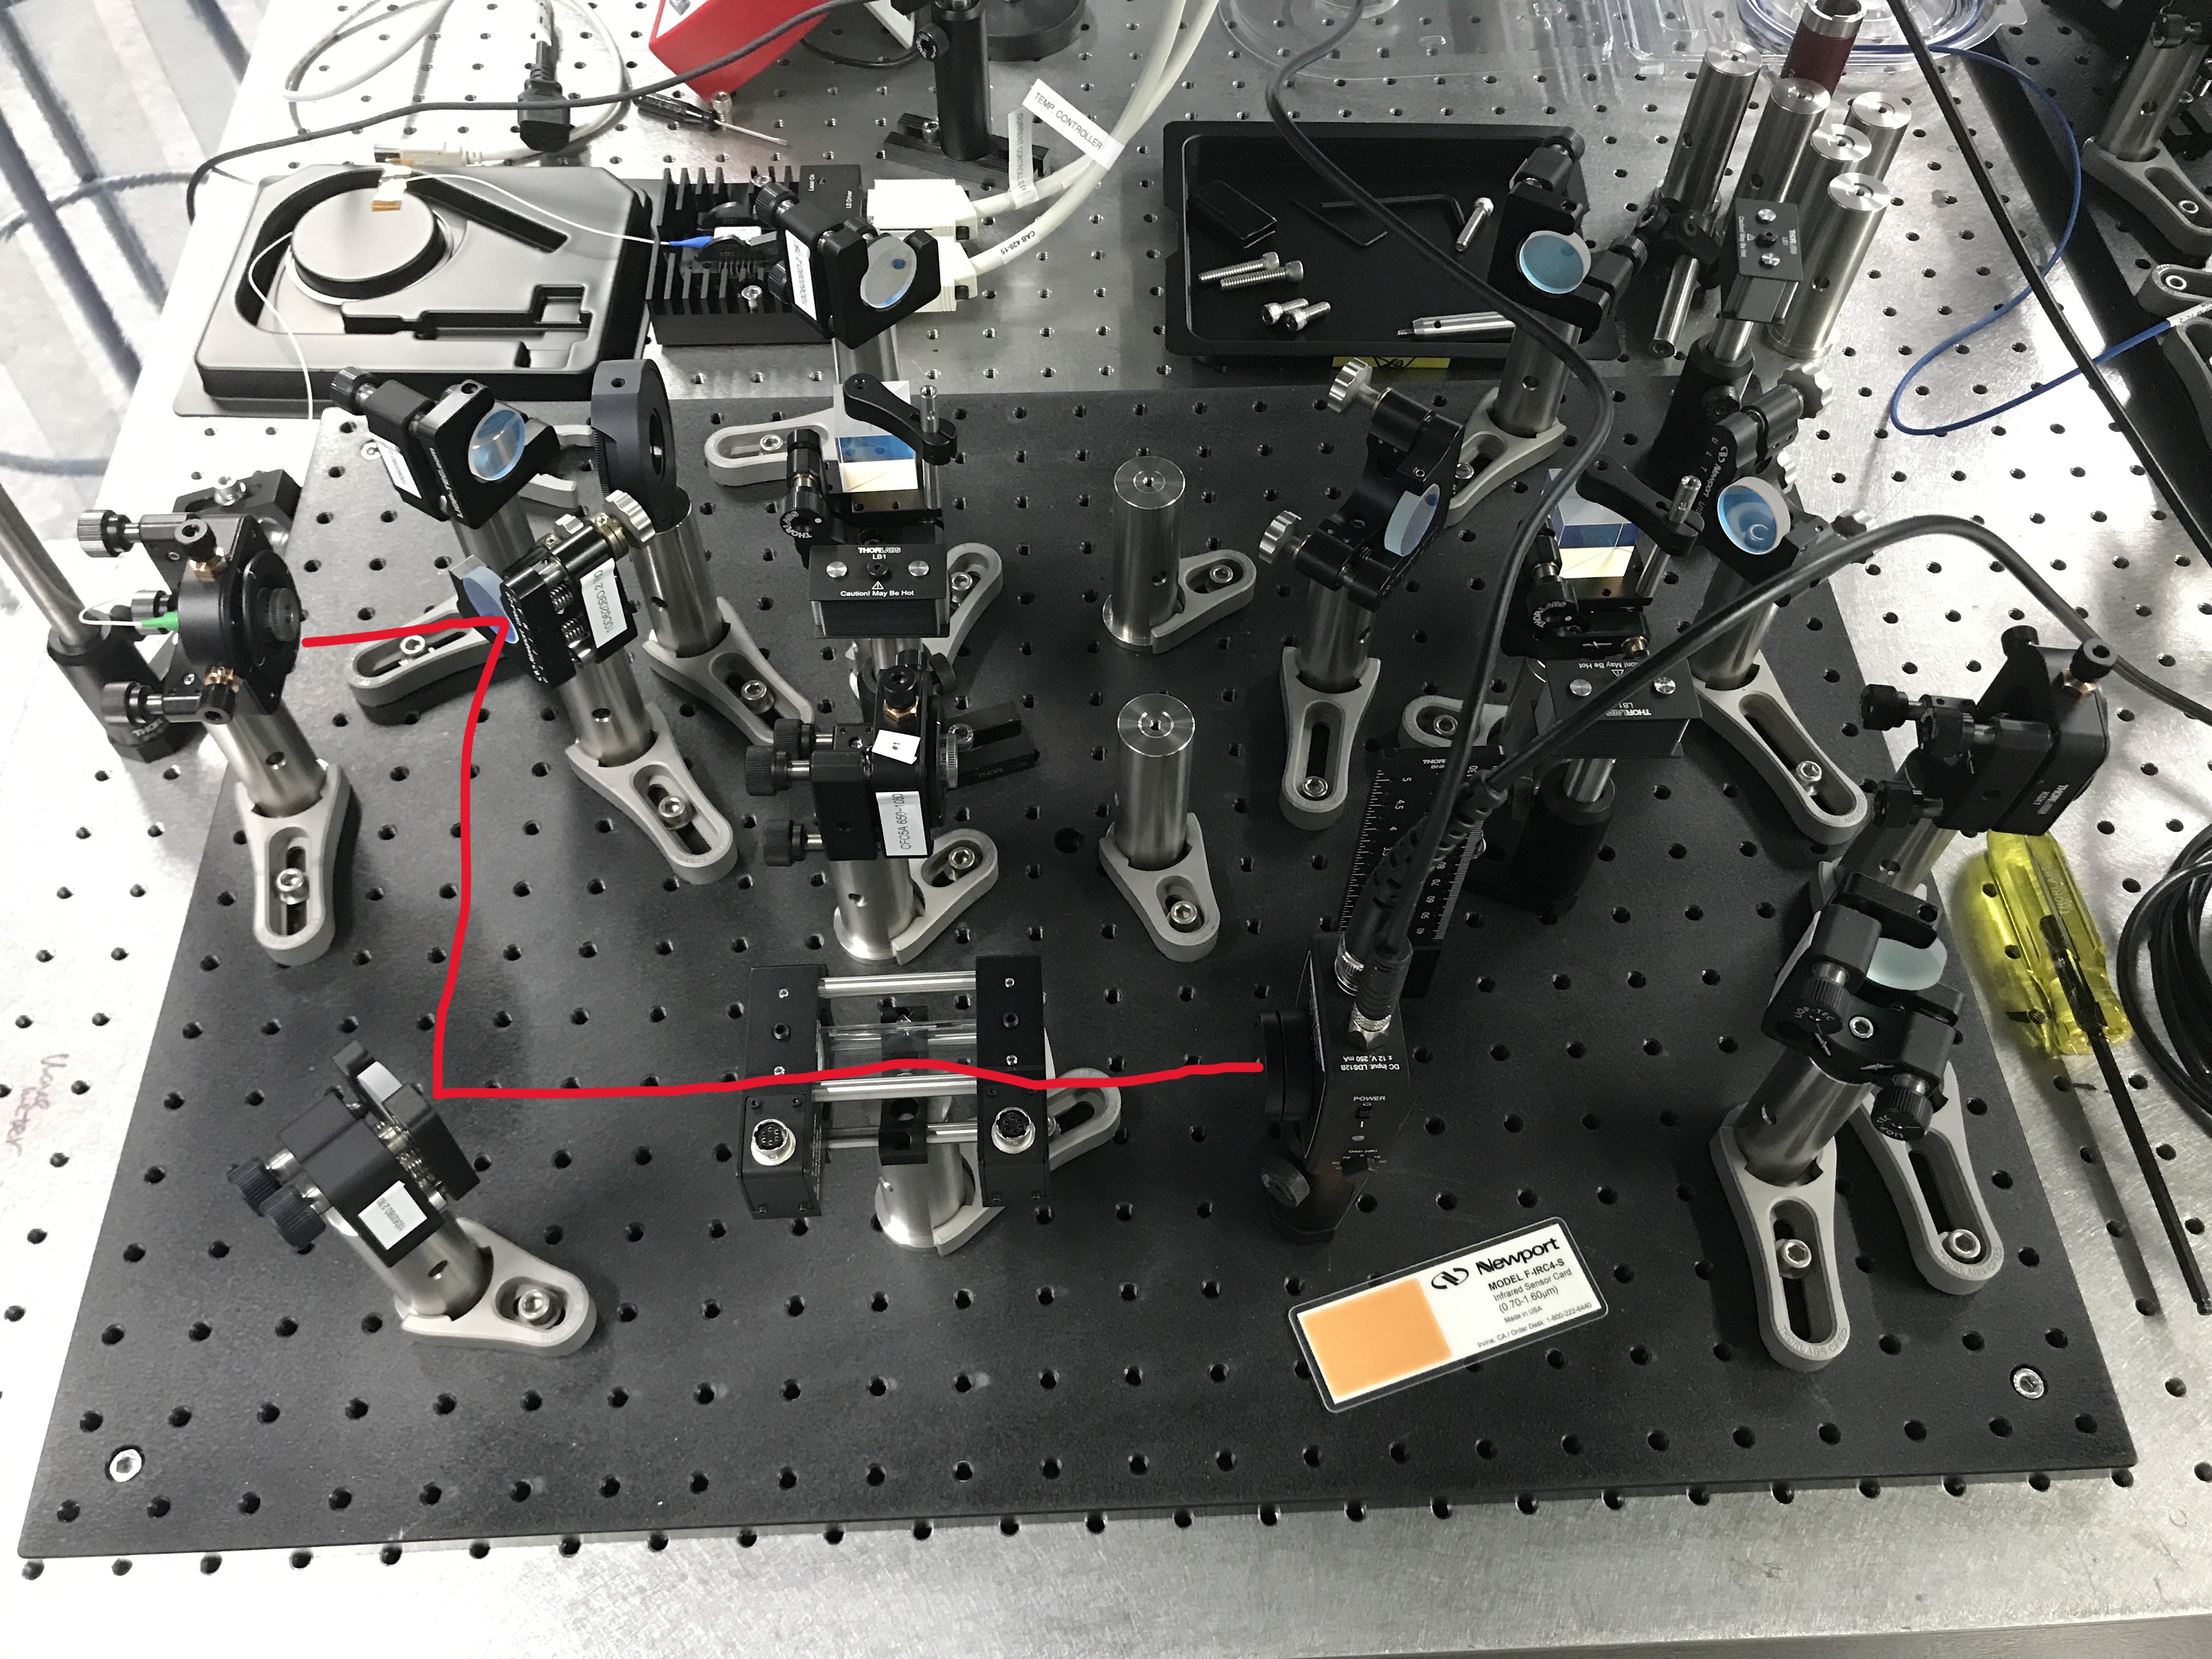
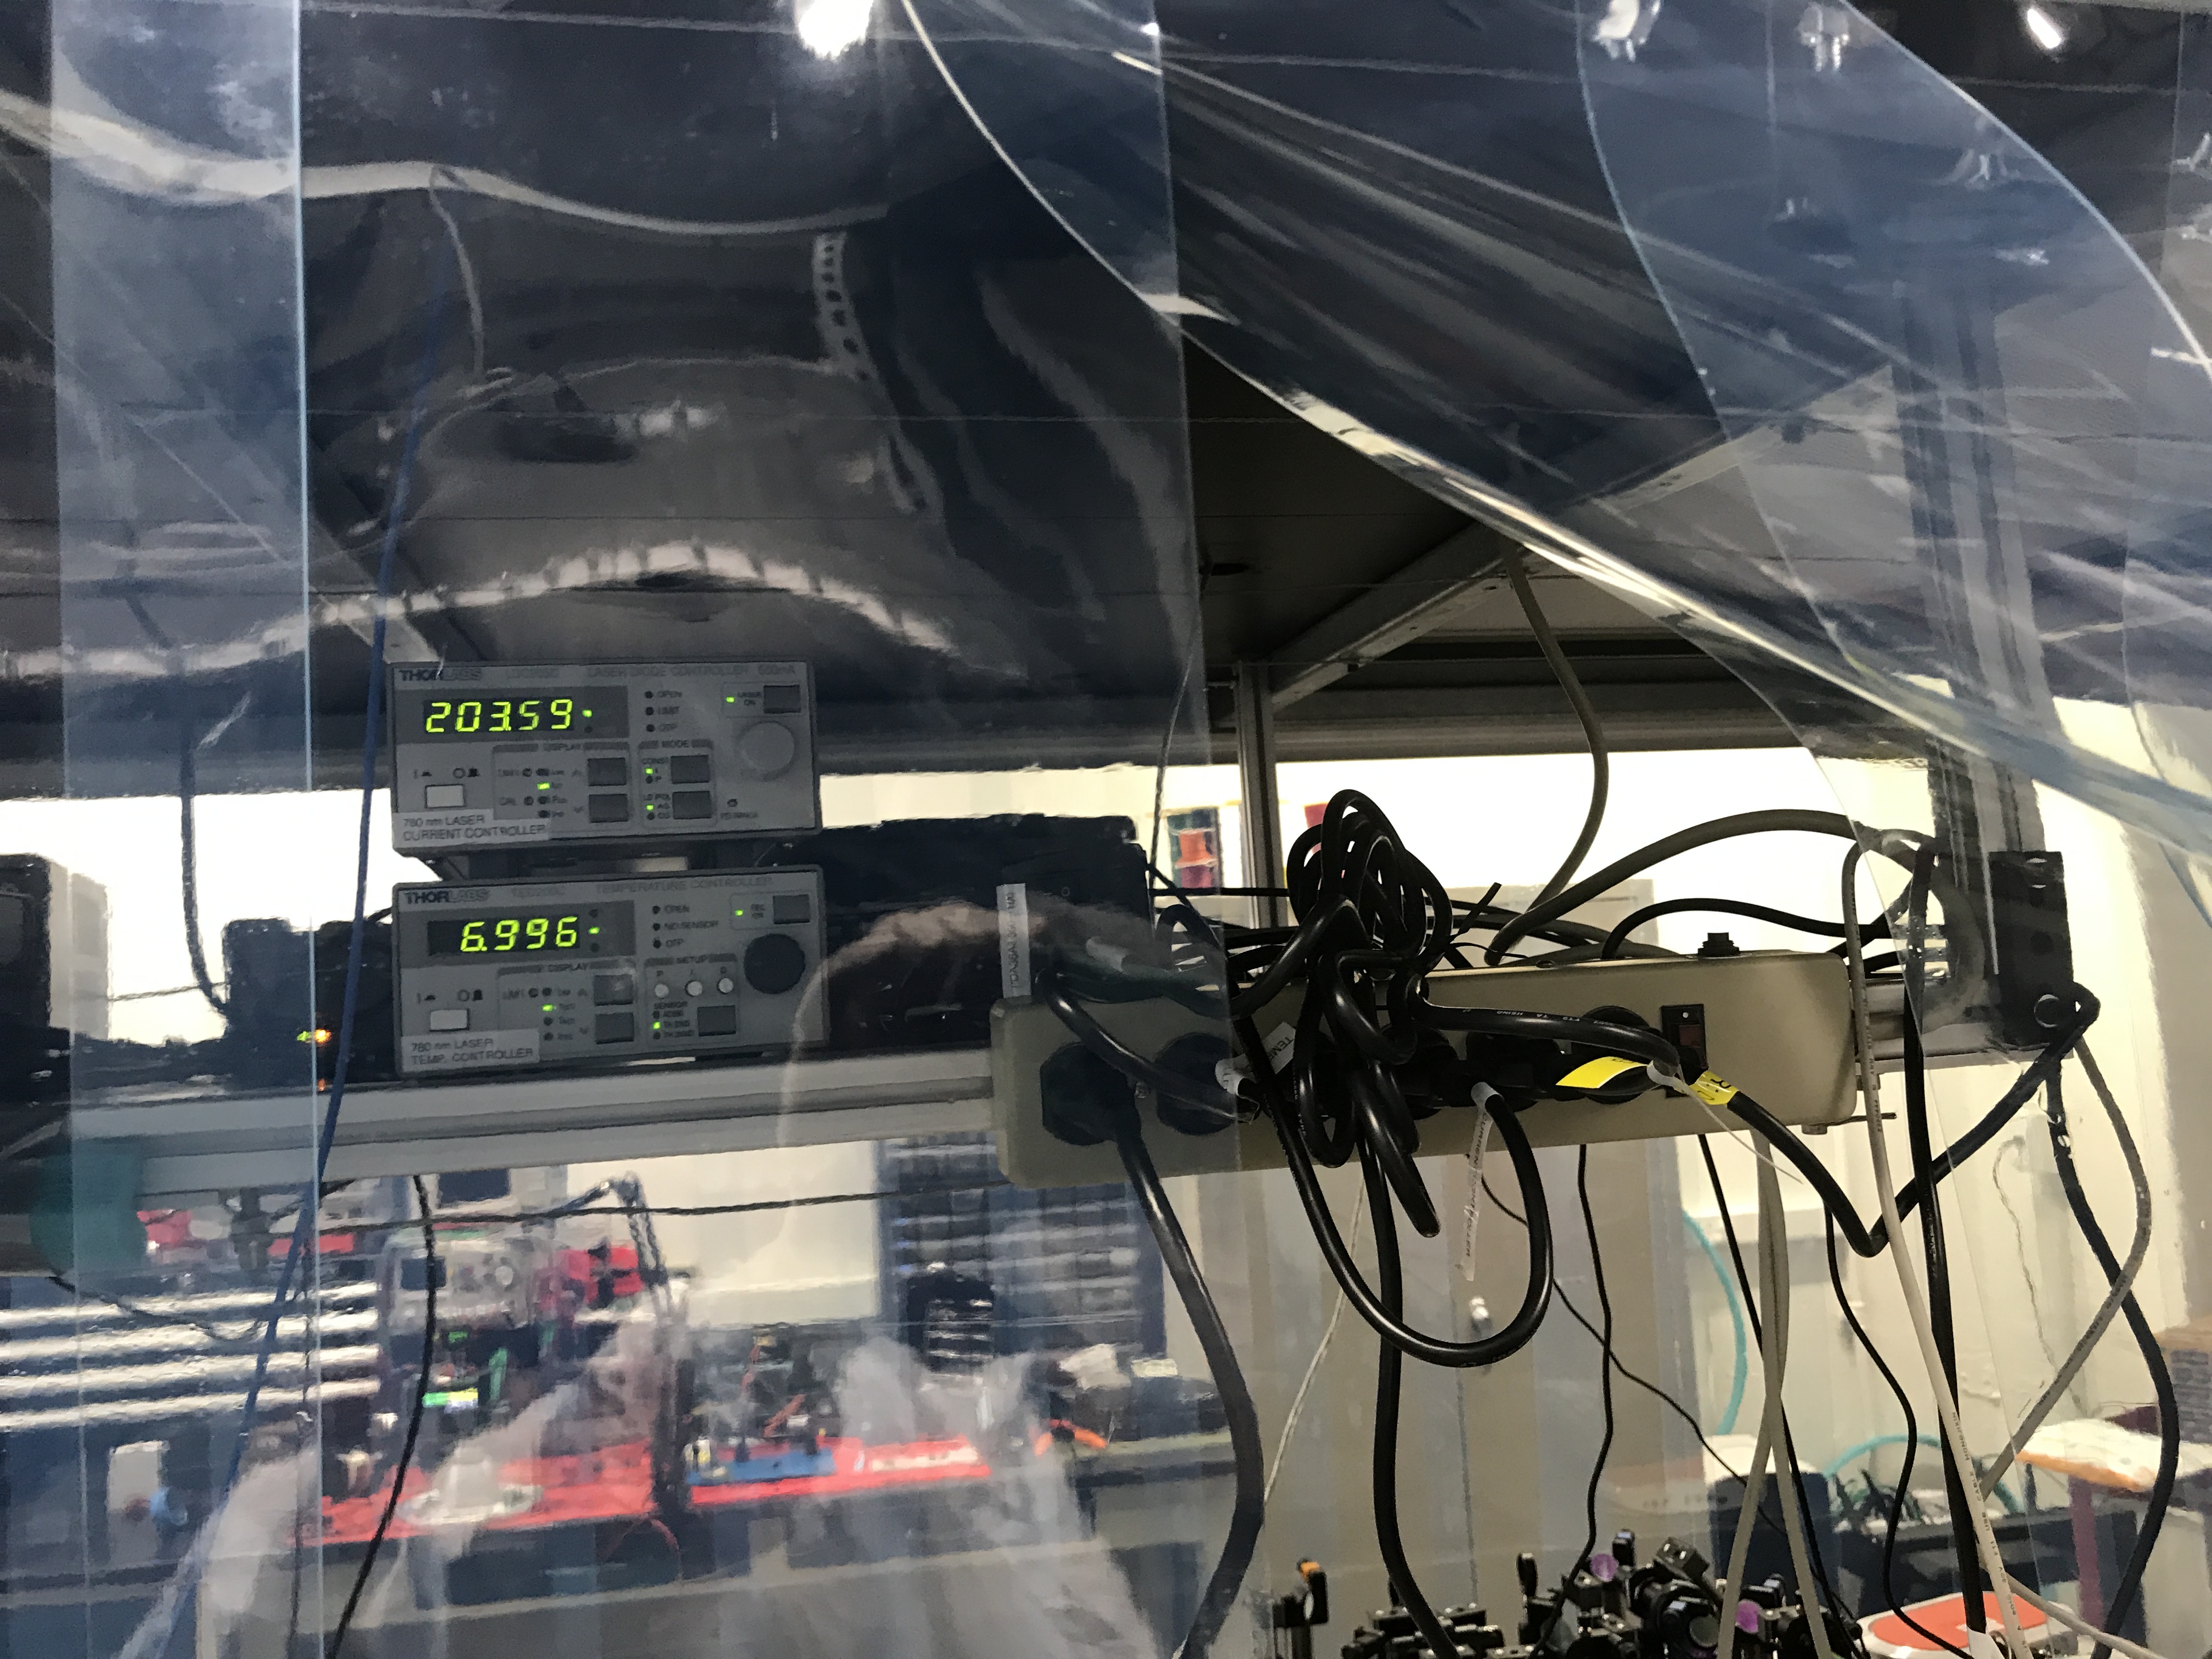
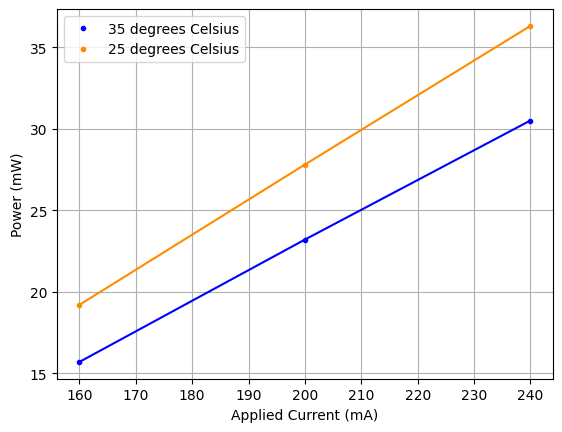
We measured absorption dips from sending the 780 nm laser through the vapor cell and measuring the output with a photodetector. The photodetector was connected with a Pomona 2249-C-96 (RG58C/U, 50 Ohm) BNC cable to the smaller Moku Go #01 (previously in the glass cabinet on the right side of the lab upon entrance). We scan through the laser's frequency by changing the laser temperature using the temp controller. Based on the laser diode spec sheet (Figure 3), at a bias current of ~200 mA, the wavelength of 780 nm is between the 25 and 35 degrees Celsius curve (corresponding to 9.99 and 6.53 kOhms respectively assuming the resistance/temperature relationship actually follows the Steinhart equation (it is slightly off but close)), so we manually changed the temperature between 6.53 and 9.99 kOhms until we saw a dip in the power reading. This occurred between 7-8 kOhms so we scanned this range of the temperature controller. We set our bias current to 203.59 mA.
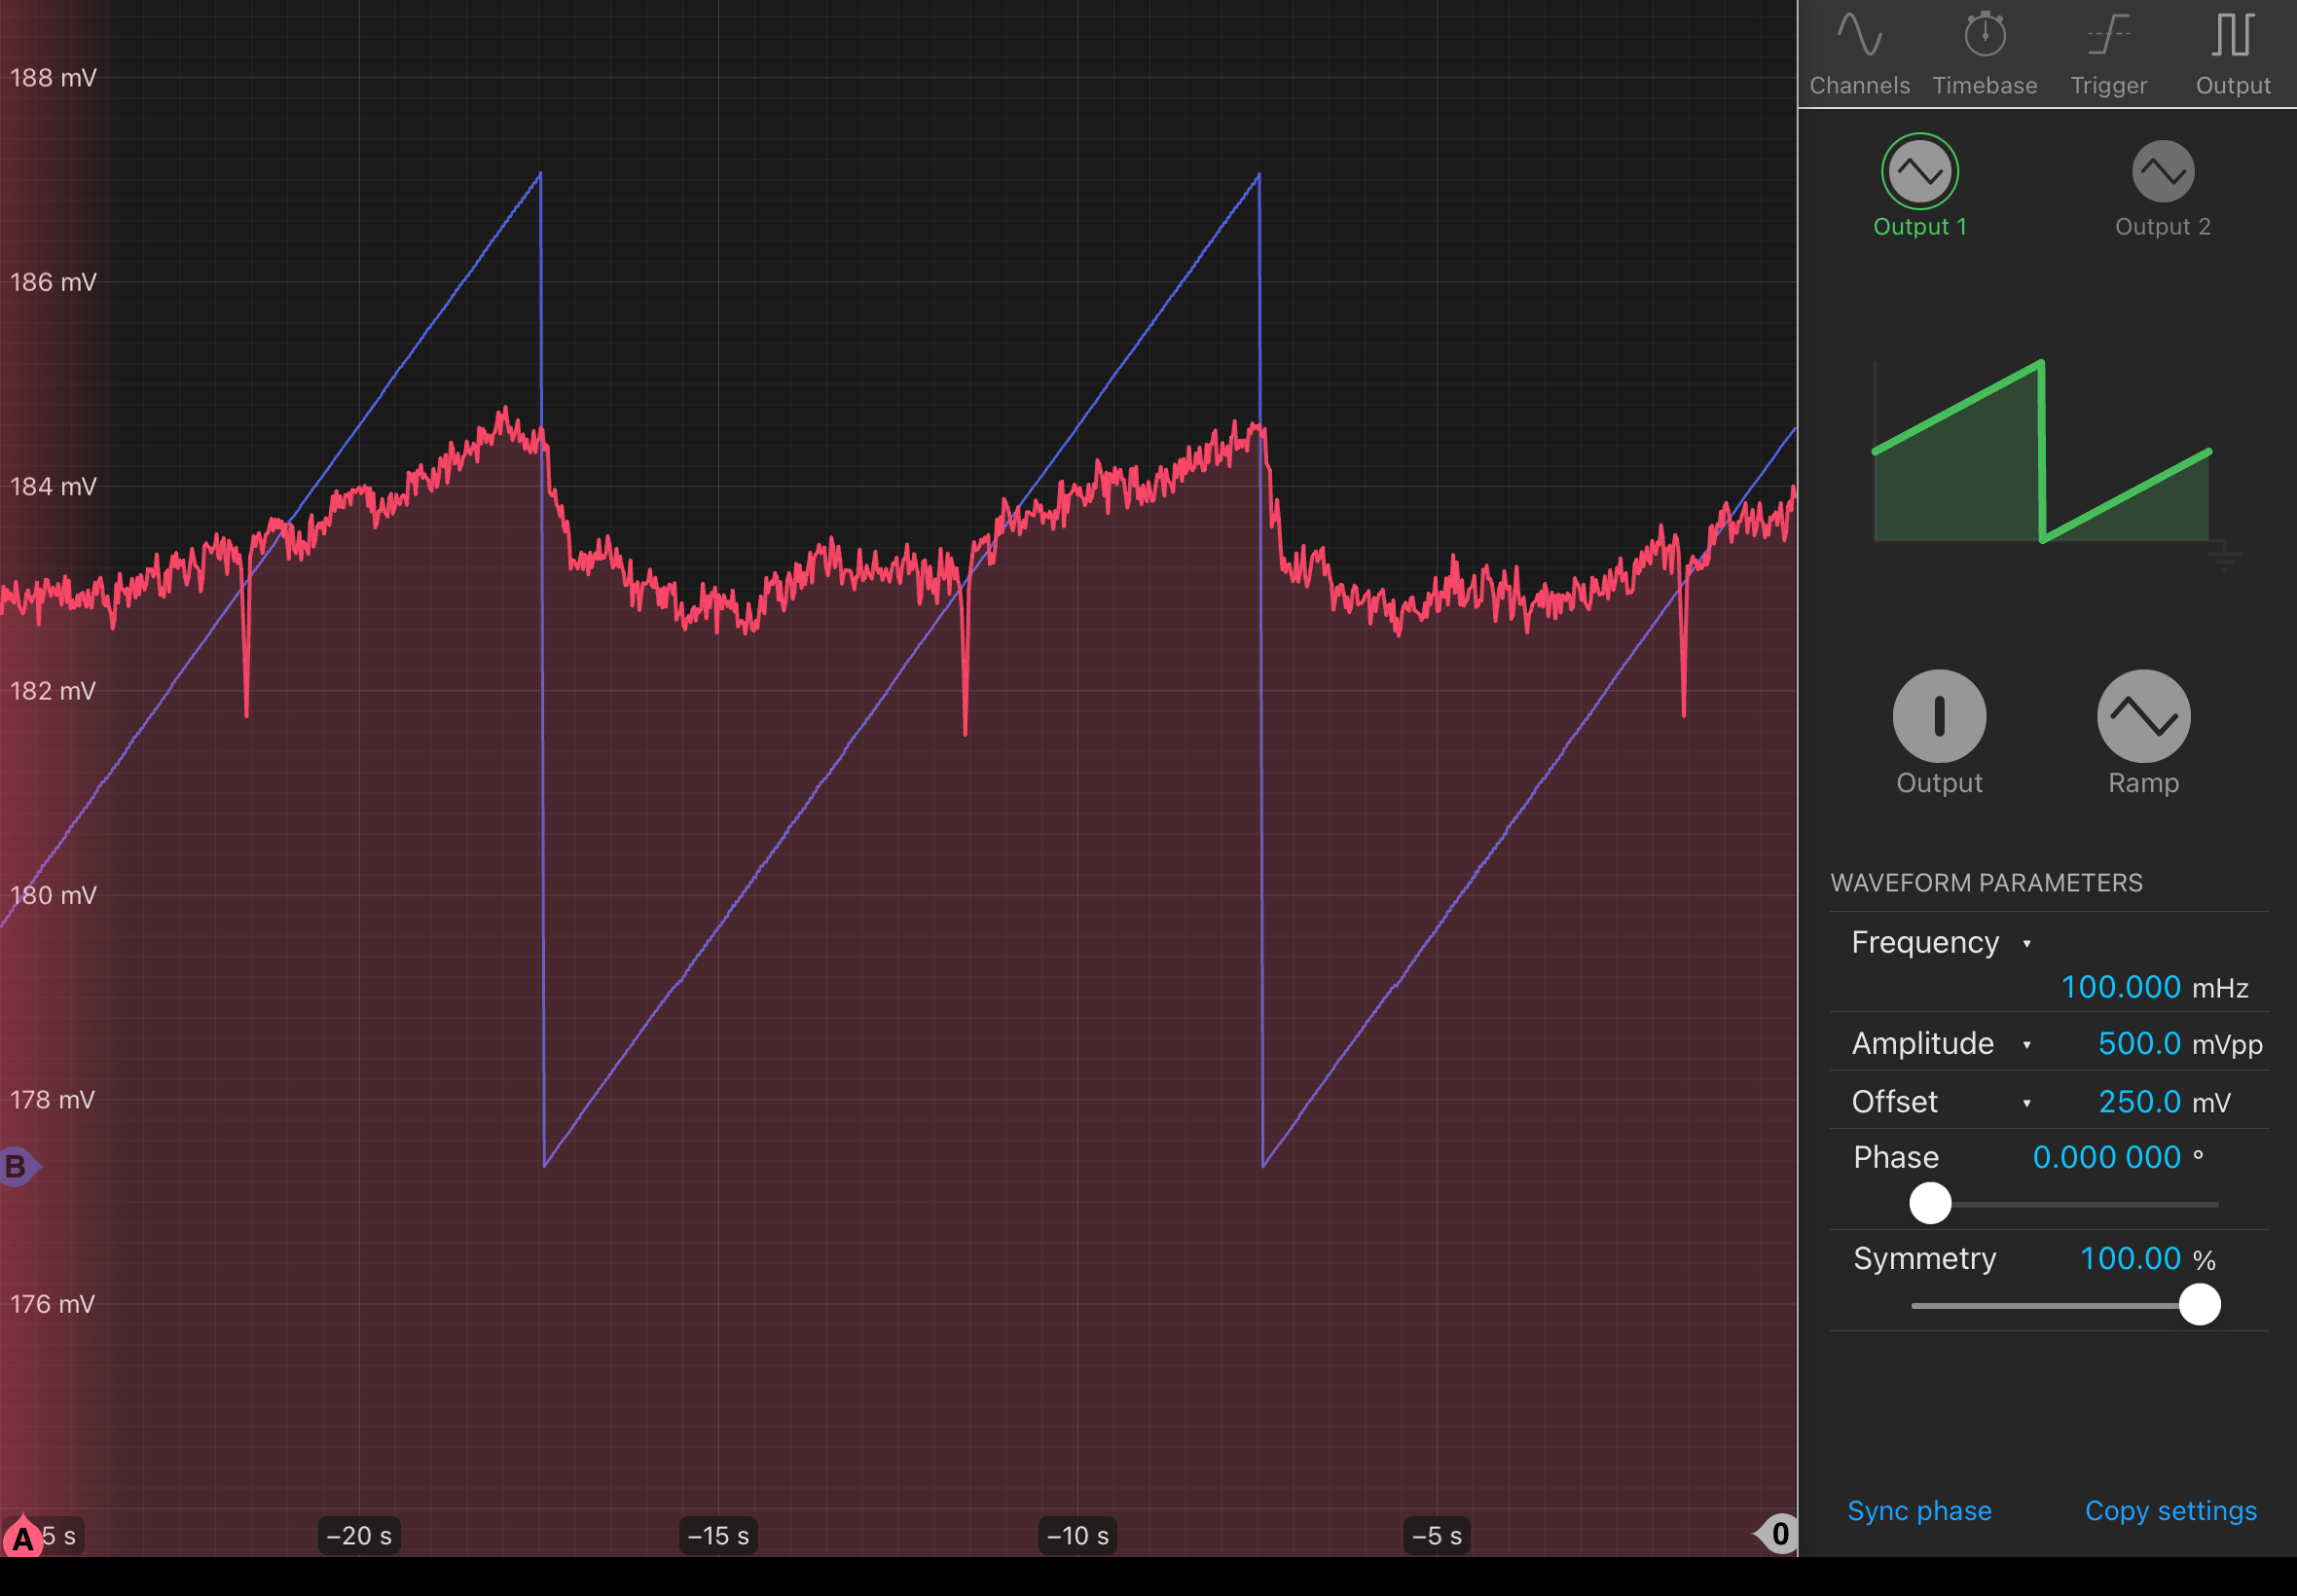
We first found the appropriate voltage to apply for scanning. From the TED200C temperature control manual, the conversion coefficient for the TH 20K (which we are using) is 2 kOhms/V. For the 1 kOhm range that we want to scan over, this means we need the signal to reach an amplitude of 1 kOhm/(2 kOhms/V) = 0.5 V. So, we manually set the temperature control at 6.996 kOhms (when the output is reset, you restart at this resistance value) and started scanning with a ramp signal (on precision acquisition mode, triggers on the rising edge) at a frequency of 100.000 mHz (determines how long it takes for you to scan the 1 kOhm range?), amplitude of 500.0 mVpp (0.5 V calculation described earlier), offset 250.0 mV (shift up the signal so it begins at 0). This enables scanning from 7-8 kOhms.
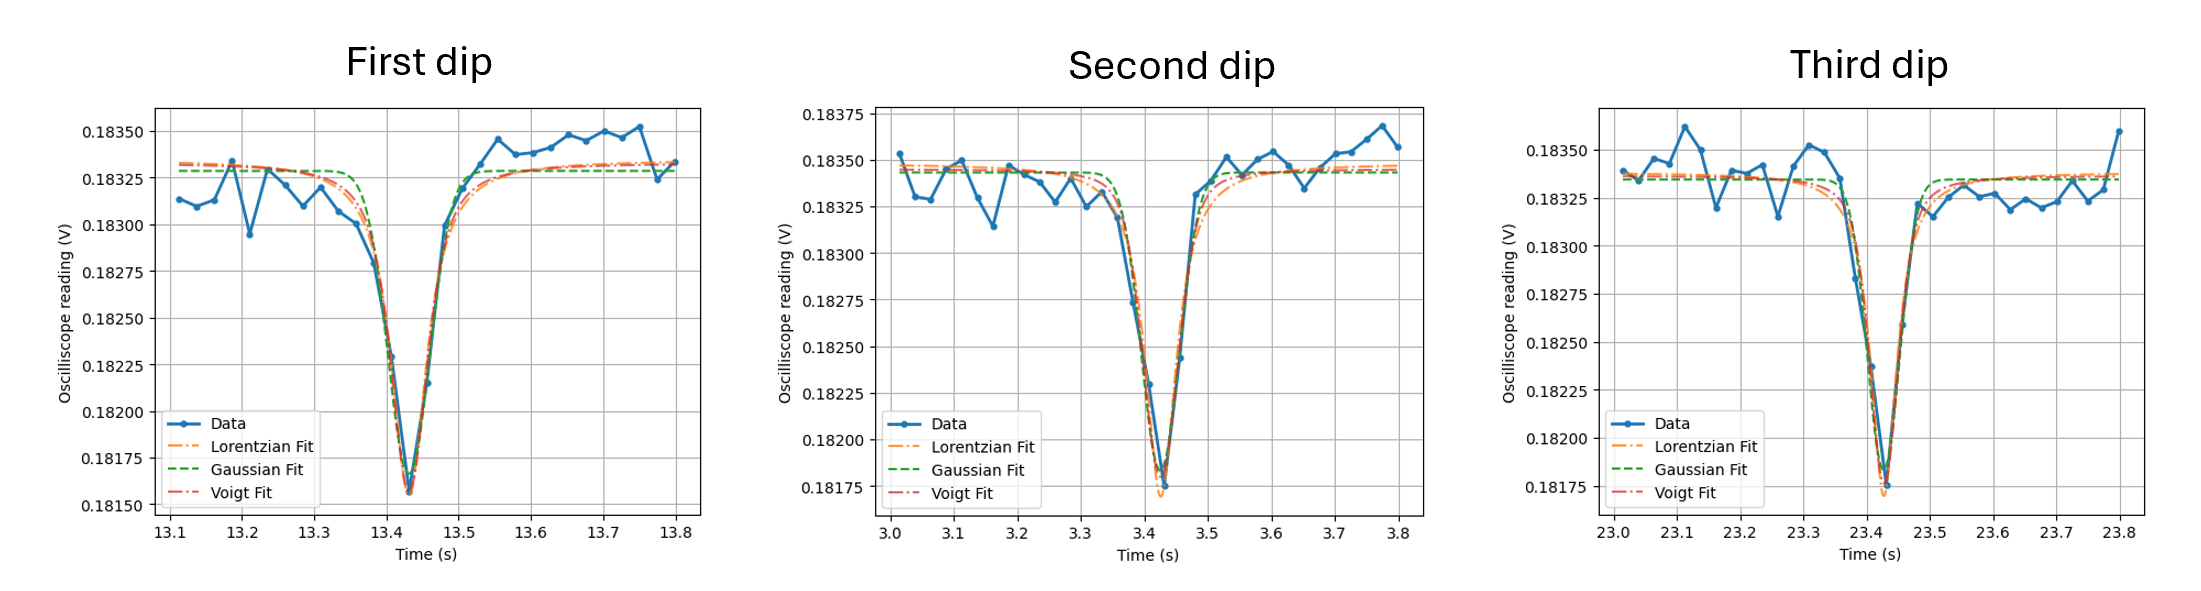
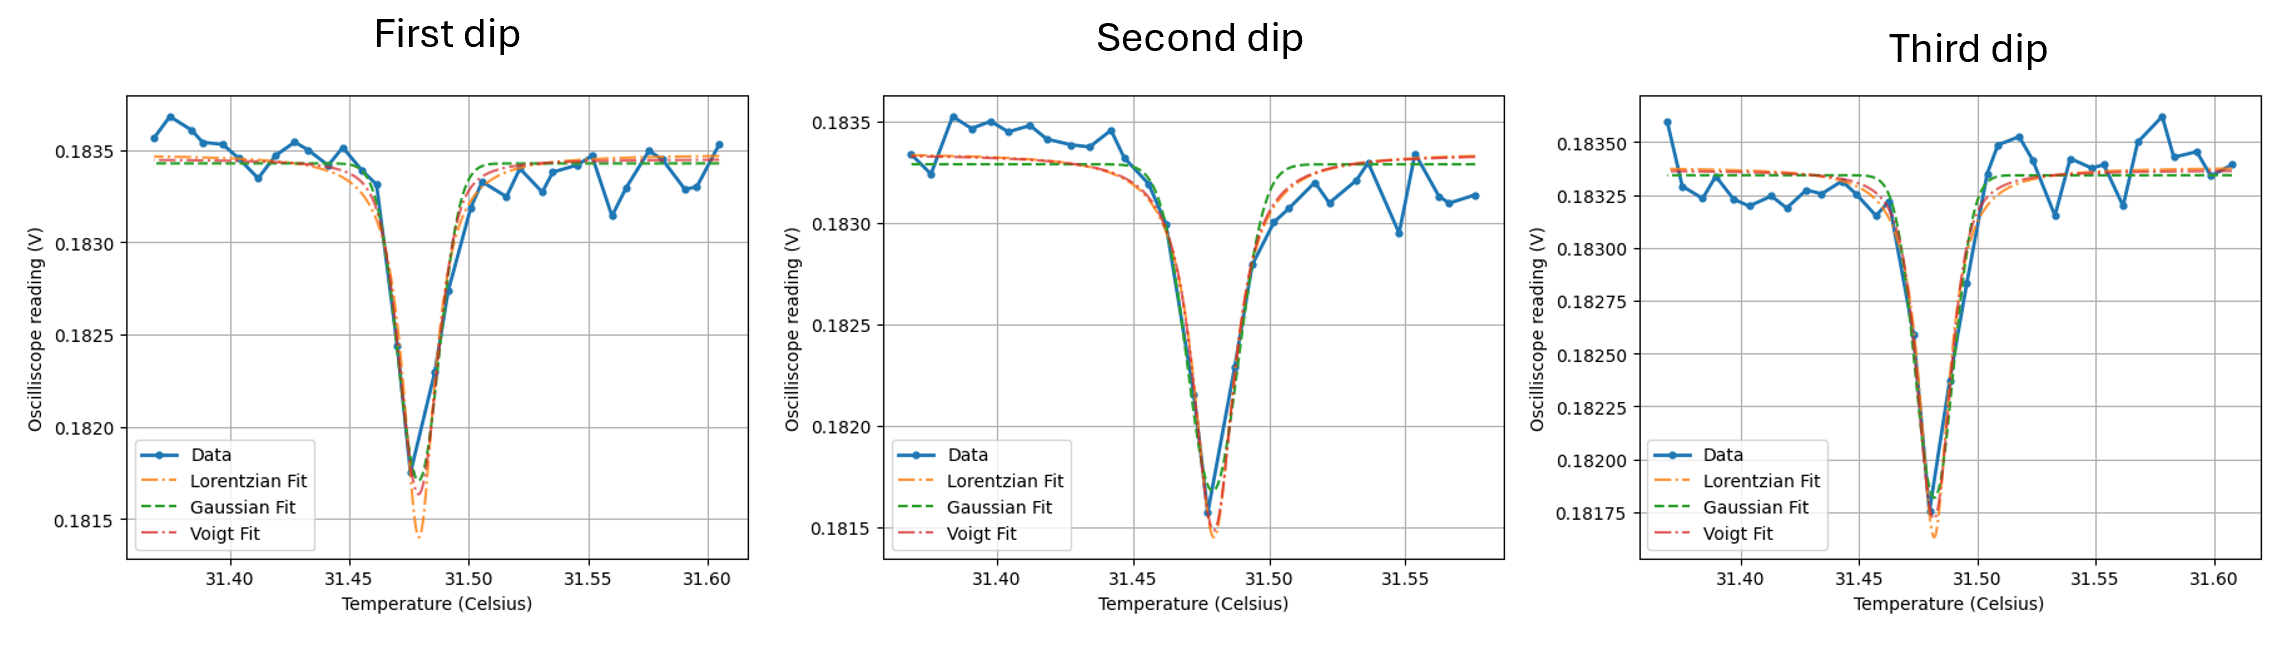
We control the set temperature by applying this voltage to the Tune In input (R1) on the back of the TED200C. The input of the temperature control is the tune-in port, which is hooked to the Moku output. The output is hooked up to the Moku input so we can see the signal. You can see consistent dips at a certain temperature, which shows the 780 ish transition is happening! We will use the vapor cell temperature controller to get a deeper dip/better resolution since the temperature of the vapor cell currently fluctuates freely. After plotting data (see attached jupyter notebook), it seems that the ~780 nm transition occurs consistently around 7.5658-7.5690 kOhms. Data is saved under Nextcloud under GQuEST/Vaporcell. Also, I fit these dips to Gaussian/Lorentzian/Voigt profiles, which I think is valid since the time relates to temperature which relates to wavelength so it should have a spectral line shape (dipsnfits for time axis and dipsnfits_temp for conversion to temperature axis). I think the Voigt profile (convolution of Gaussian/Lorentzian) would make the most sense to fit to since there is probably a combination of homogeneous (Lorentzian) and inhomogeneous (Gaussian) broadening in the system. There's not a lot of data points to work with though and the tails have some curve to them because of scanning, so the fits should be taken with a grain of salt. Jupyter notebook has these plots + relevant values. Maybe you can get how much the laser wavelength fluctuates by from the FWHM or standard deviation of temperature at minimum transmittance? (since temperature relates to wavelength) Not sure, should probably think more about that.
Also, we confirmed that the measured power of the 780 nm laser with the black stick-like photodetector agrees with the spec sheet for 25 and 35 celsius at various current settings (160-240 mA) (laserpowerconfirmation.png picture) on 500 mW setting. Relationship between power and current seems linear like the images in the spec sheet. Also, all twelve 780 mirrors for the vapor cell setup have been mounted.

Update: these data files are now located in the Nextcloud under Users/briana/20240712_Absorption_Meas/