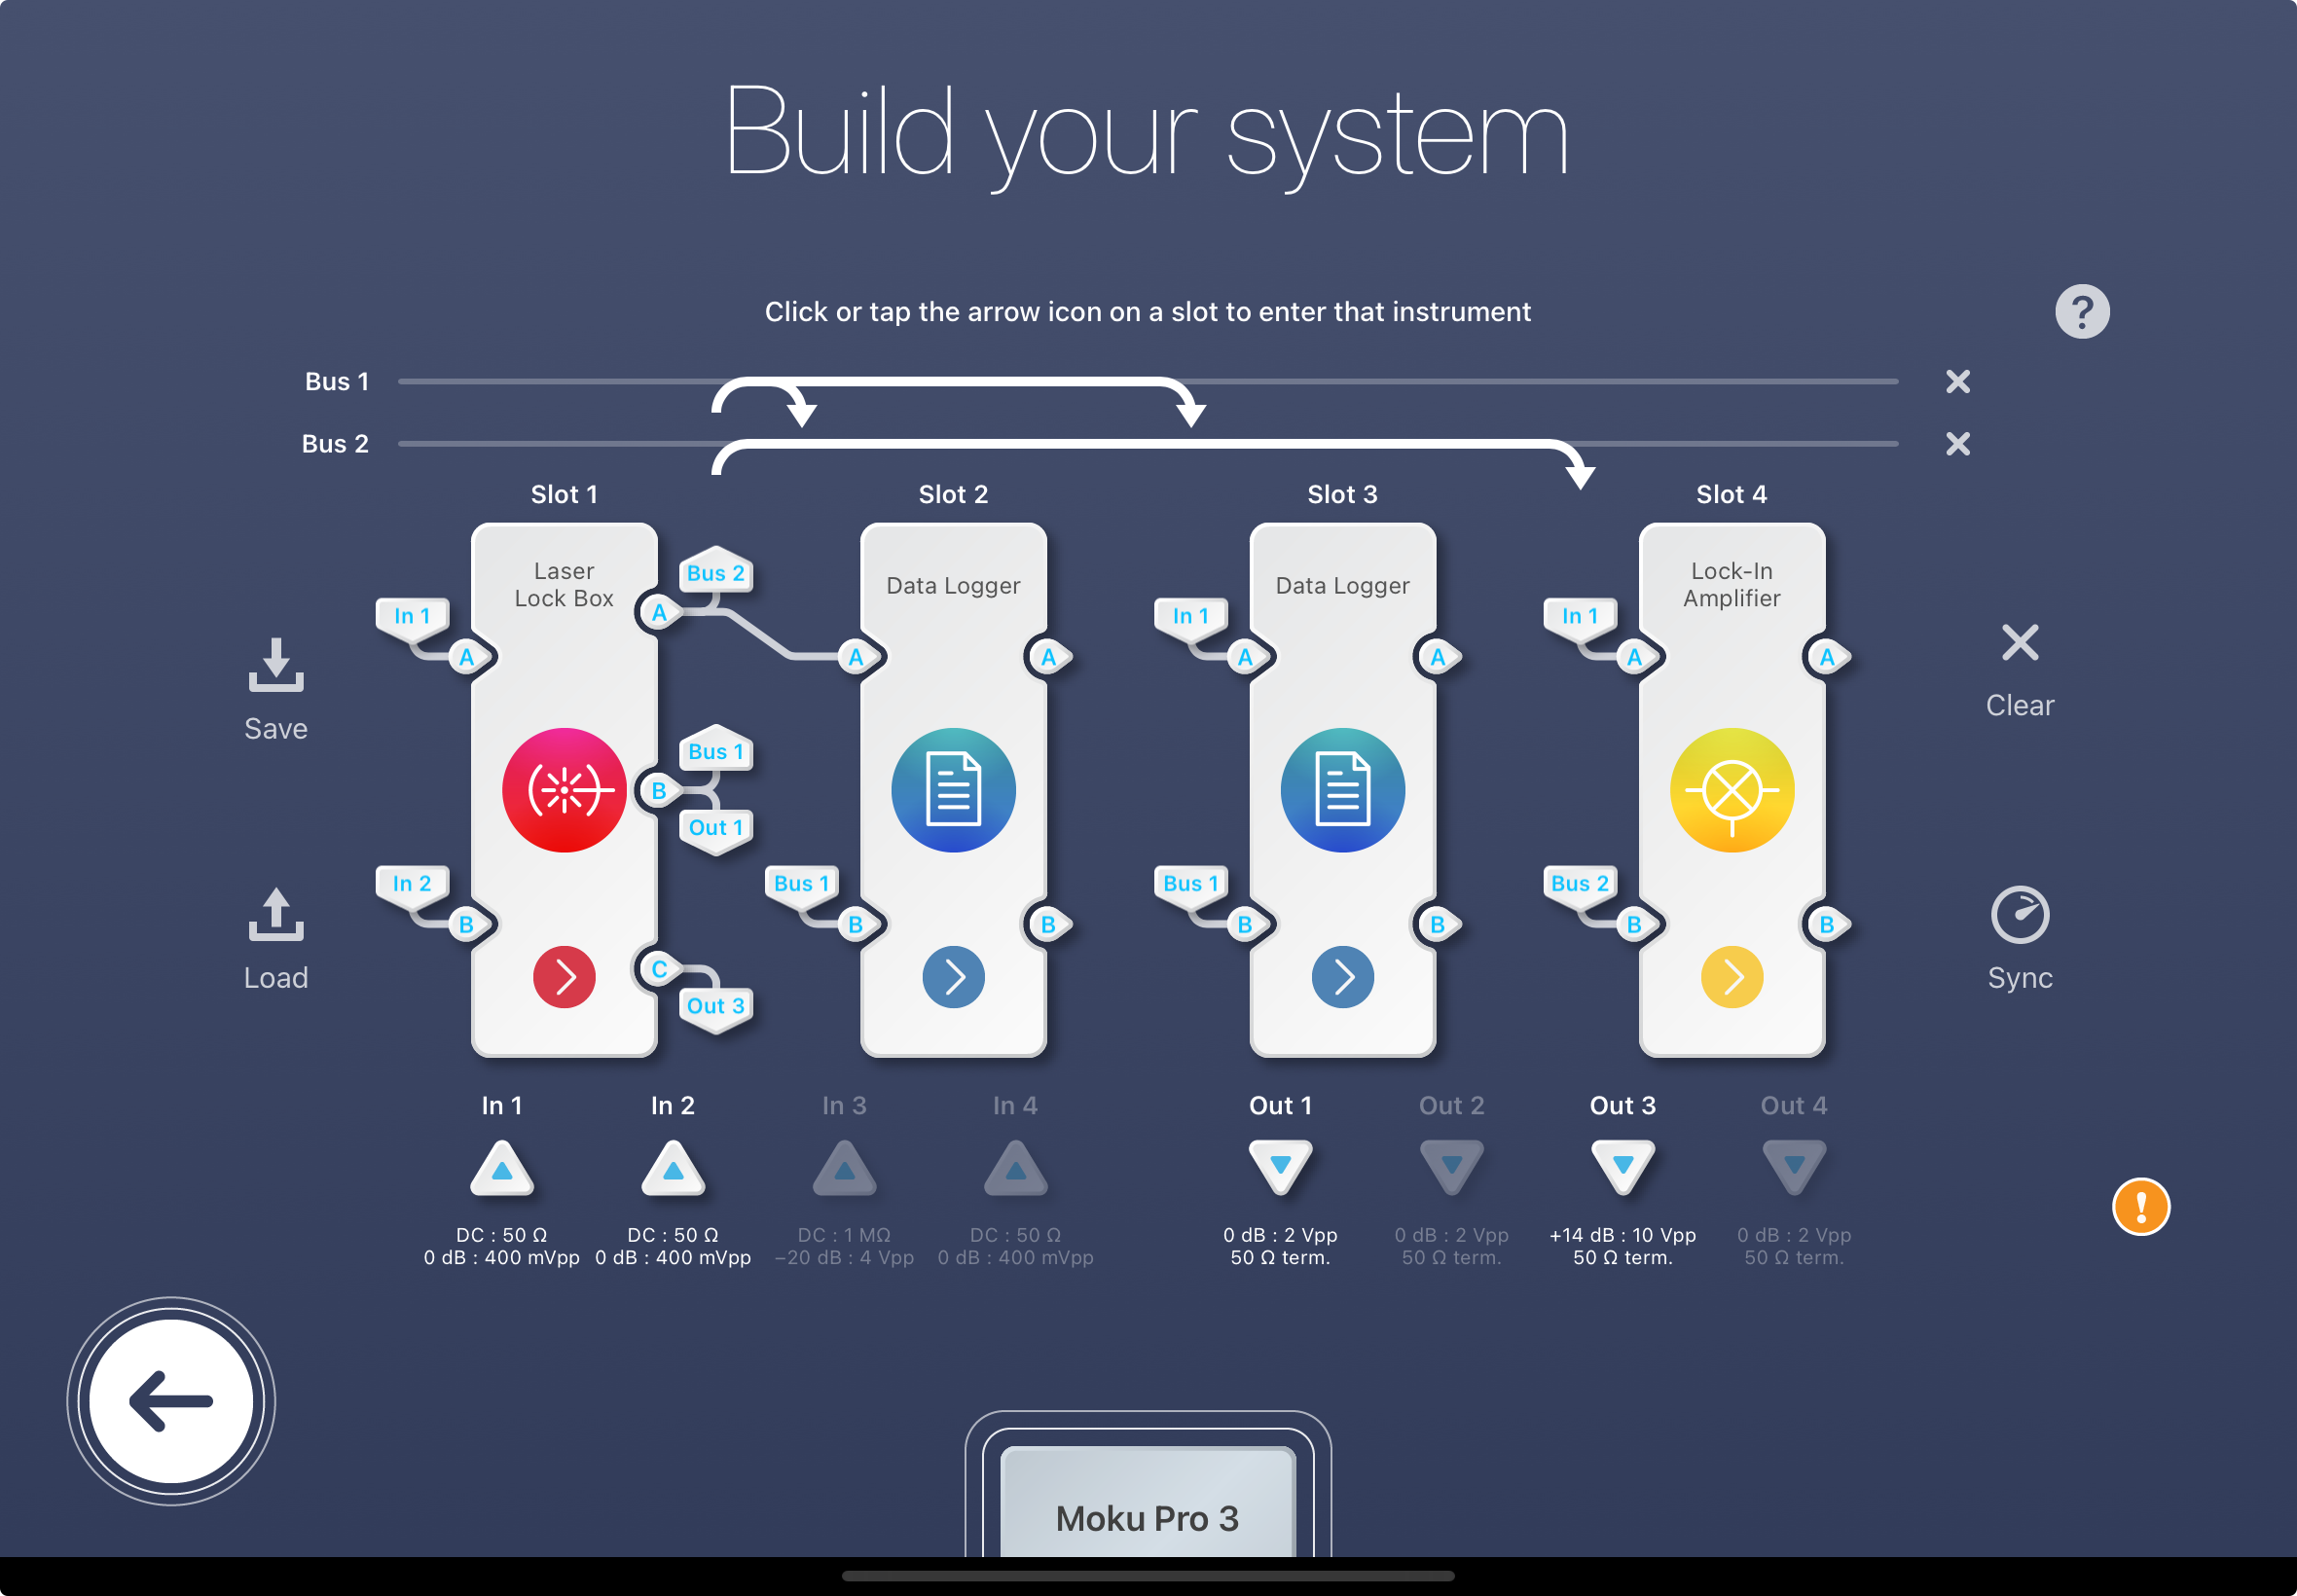
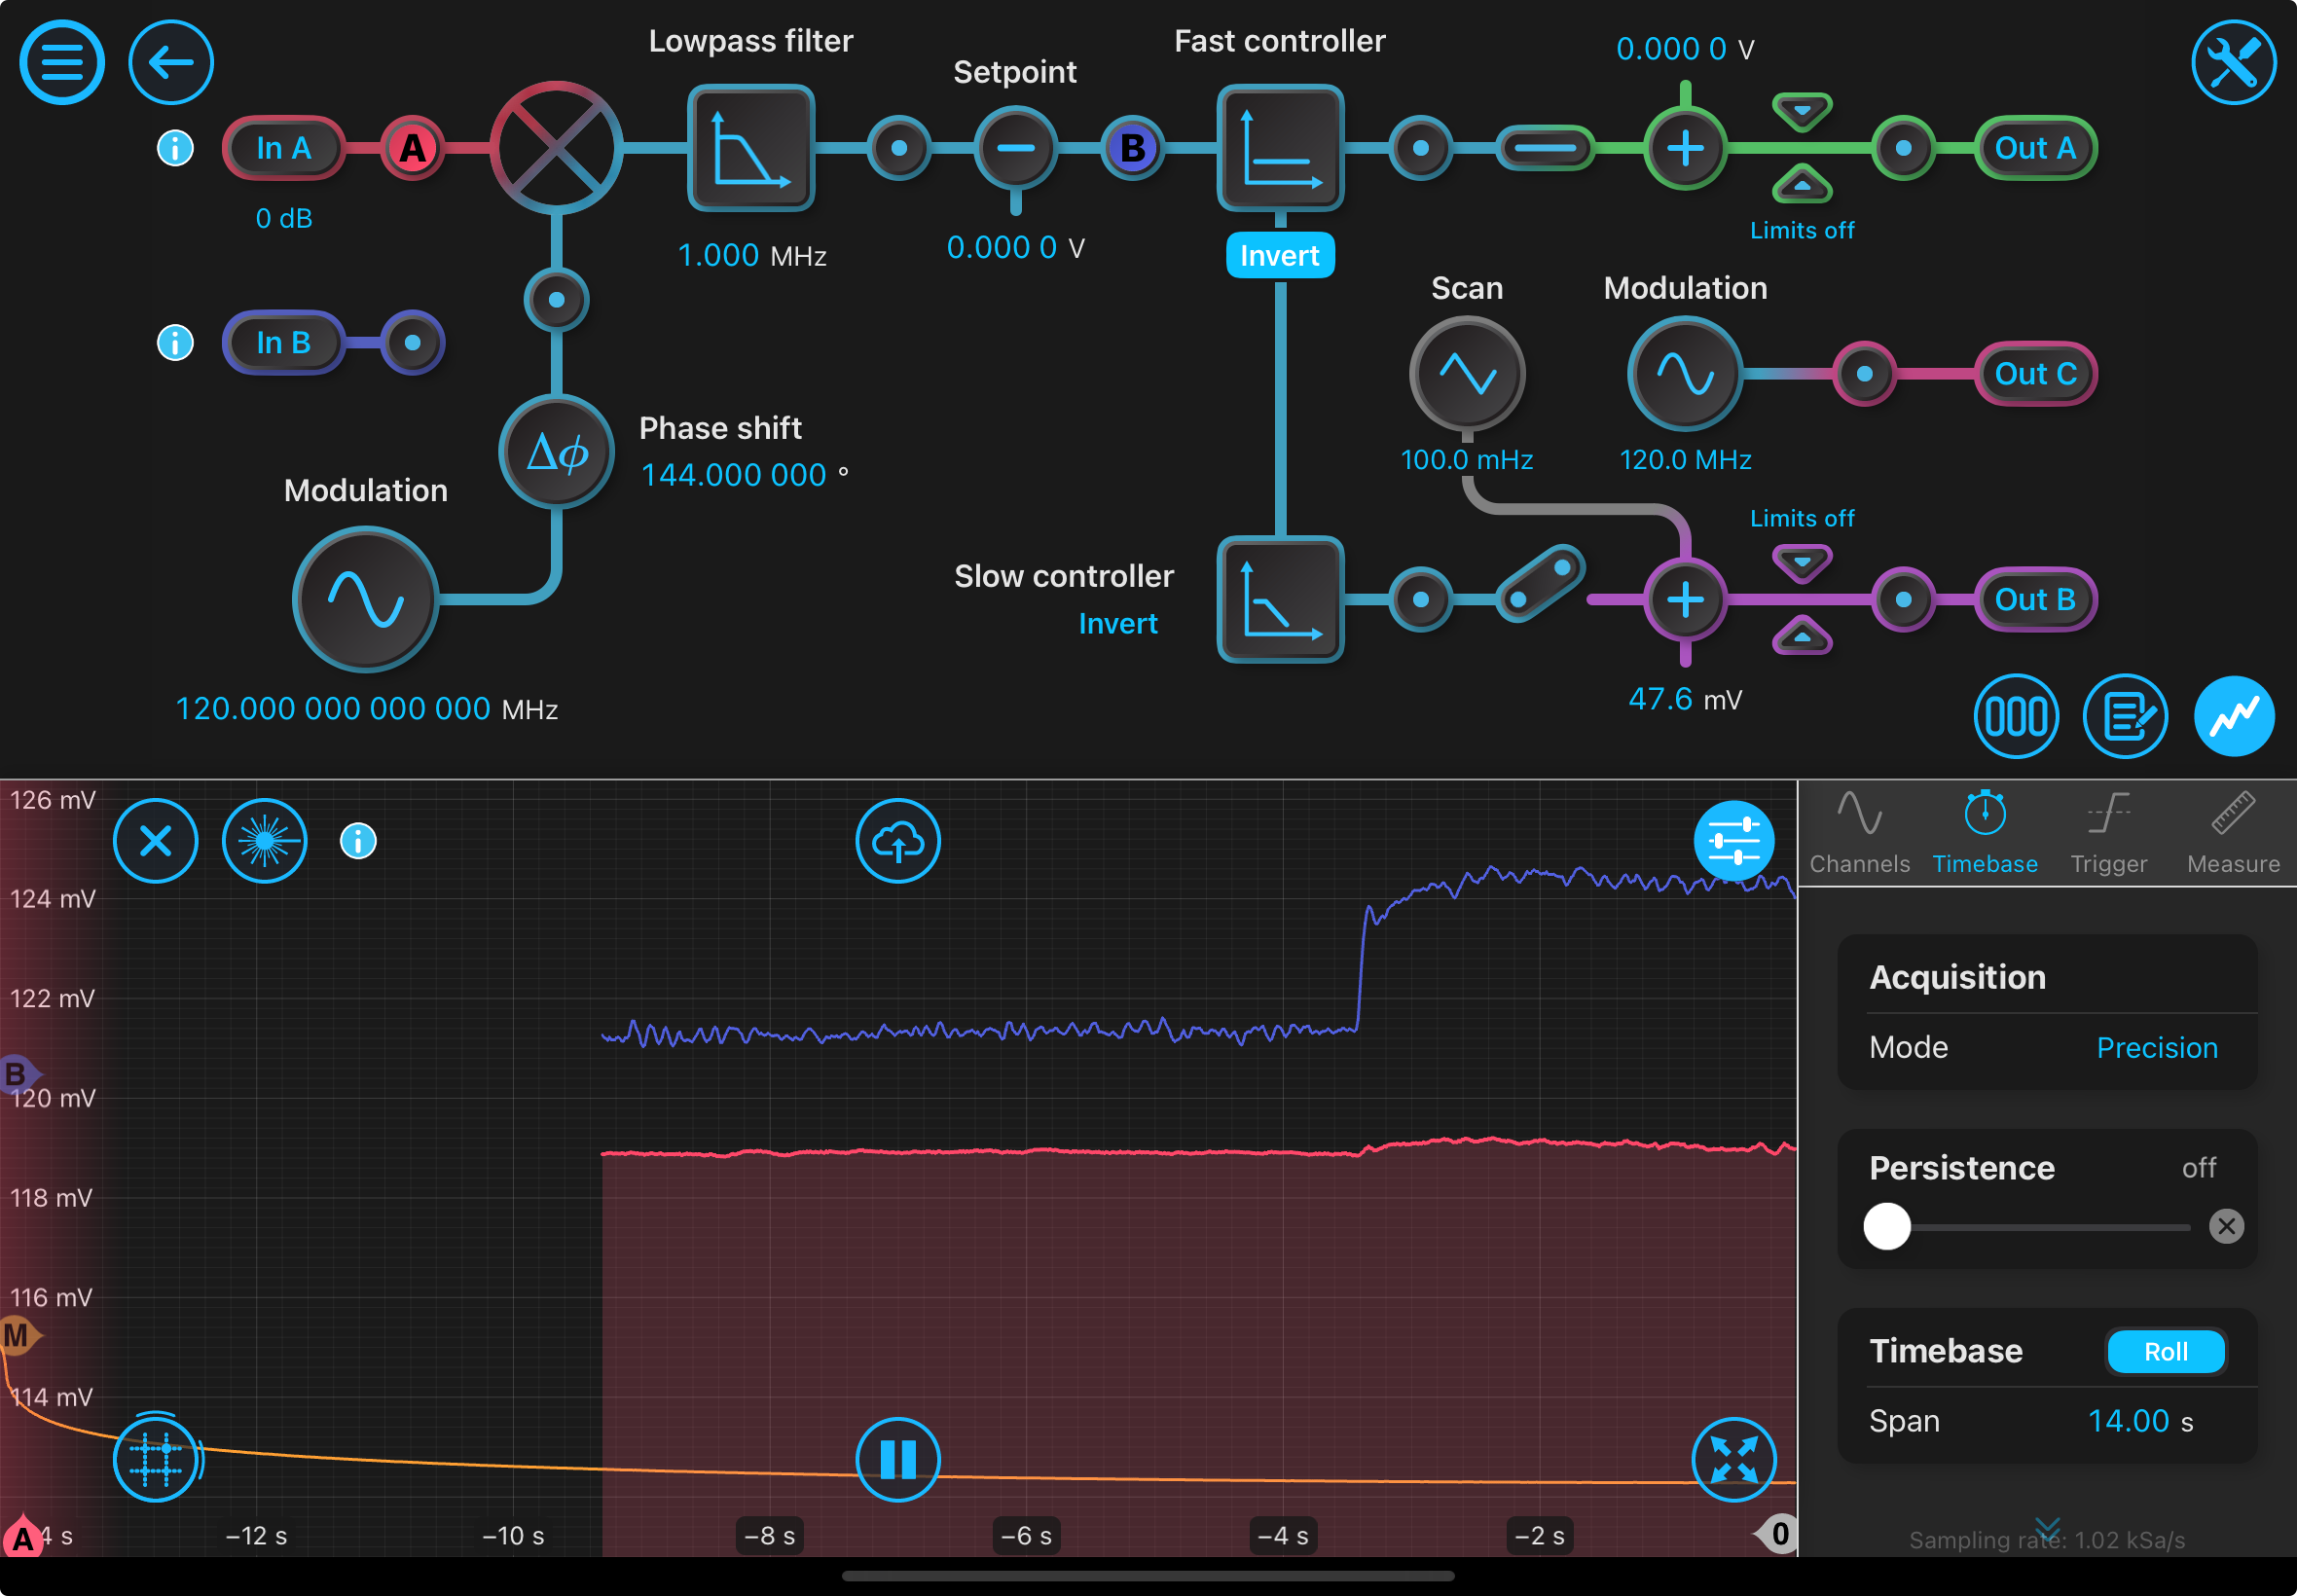
To collect data from three channels, you can use the triggered data logging. Go to the data logger and set Start -> Triggered then click record. It won't start recording until the trigger hits. I set the trigger to come from the temperature scan signal reaching a certain voltage amount (1 mV). This trigger is the same for both data loggers and then you can enable the temperature scan on the laser lock box to start data collection (once it reaches 1 mV). The two data loggers take up two slots on the multi-instrument mode which is not ideal since we may need more ports for other purposes, but this process works for getting data from >2 channels. The trigger channel needs to be an input channel, it cannot be the external trigger channel. See configuration here: multipledataloggers.png. For now, the Moku Go has been put back on the previously electronics table since we don't need it anymore.
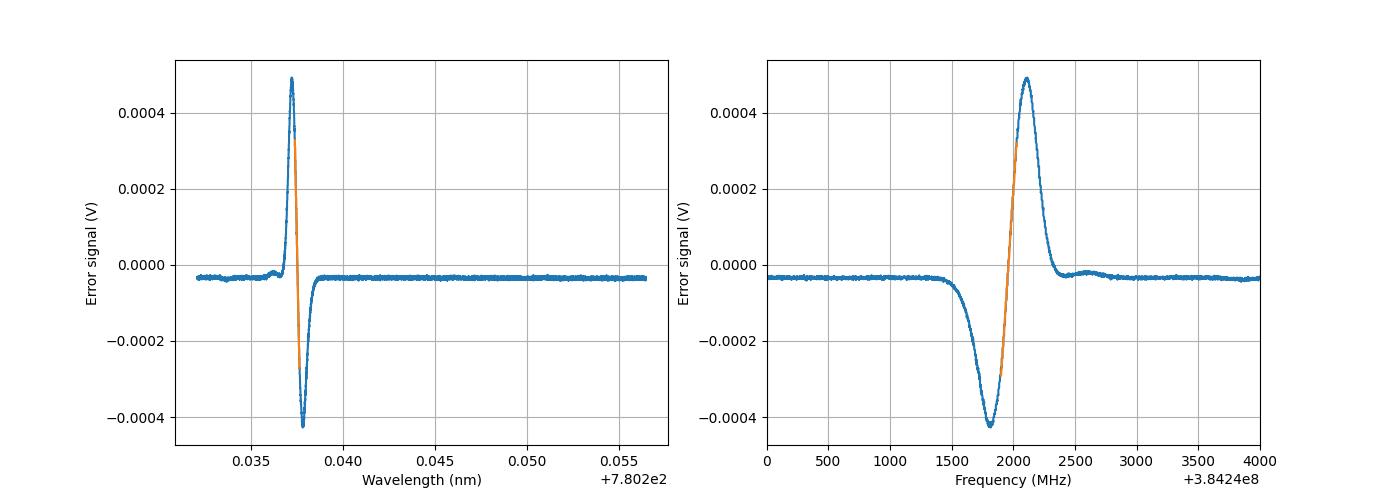
Retook data (error signal, PSDs) just for a clean slate and also with the above settings since we don't have to shift anything anymore. Because we are using the slow controller, we don't have the issue that Torrey had with having to divide out the effect of the controller from the control signal to get error signal. We can just output it directly from the fast controller track (setting the gain to 0 dB so it essentially doesn't do anything). The measured error signal today is found here: error_signal.png. The magnitudes of the slopes are (V/nm): ~2.40, (V/Hz) ~4.89e-12.
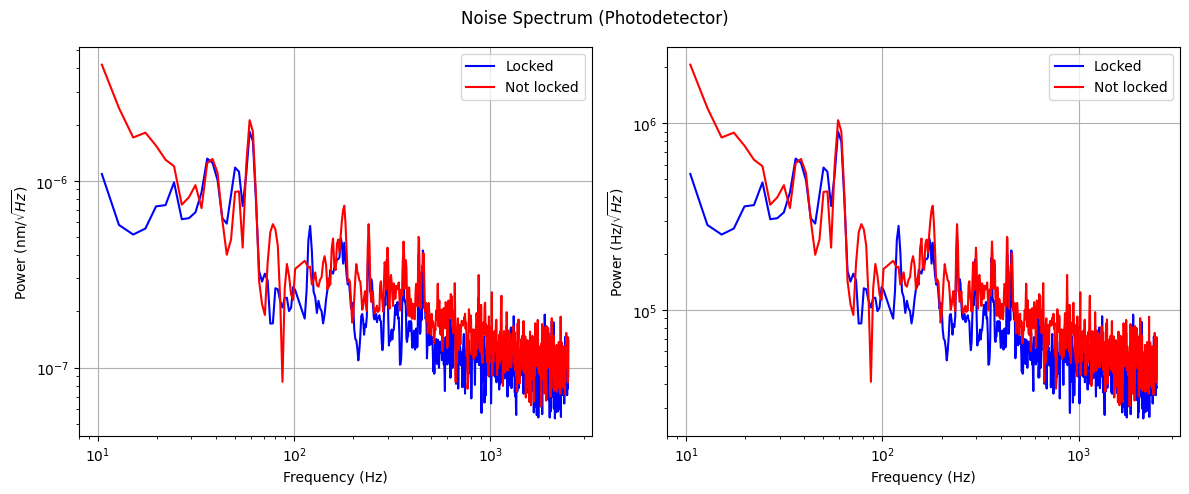
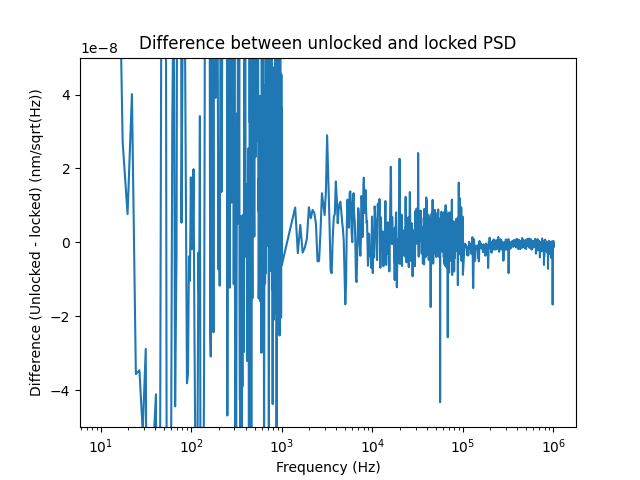
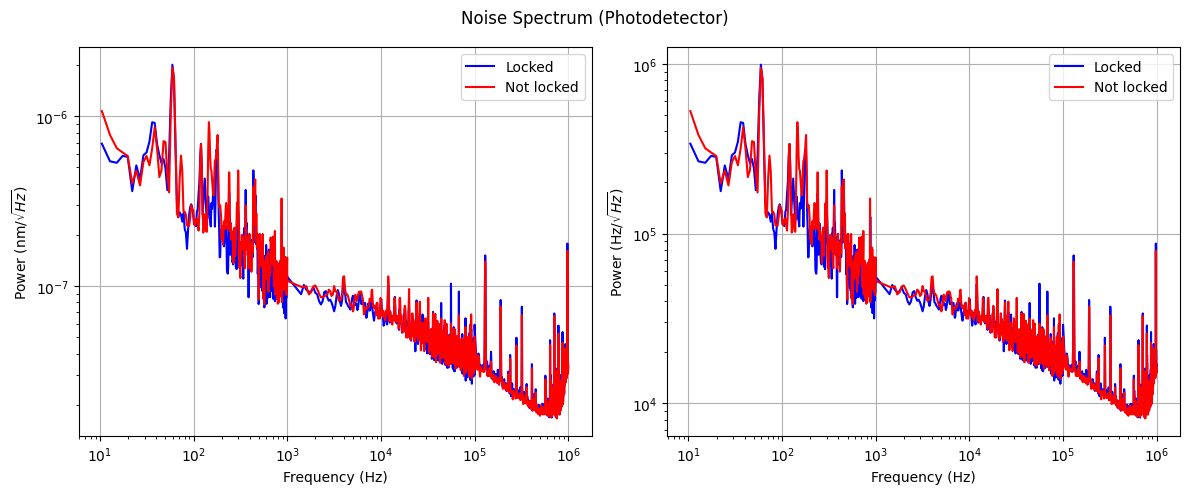
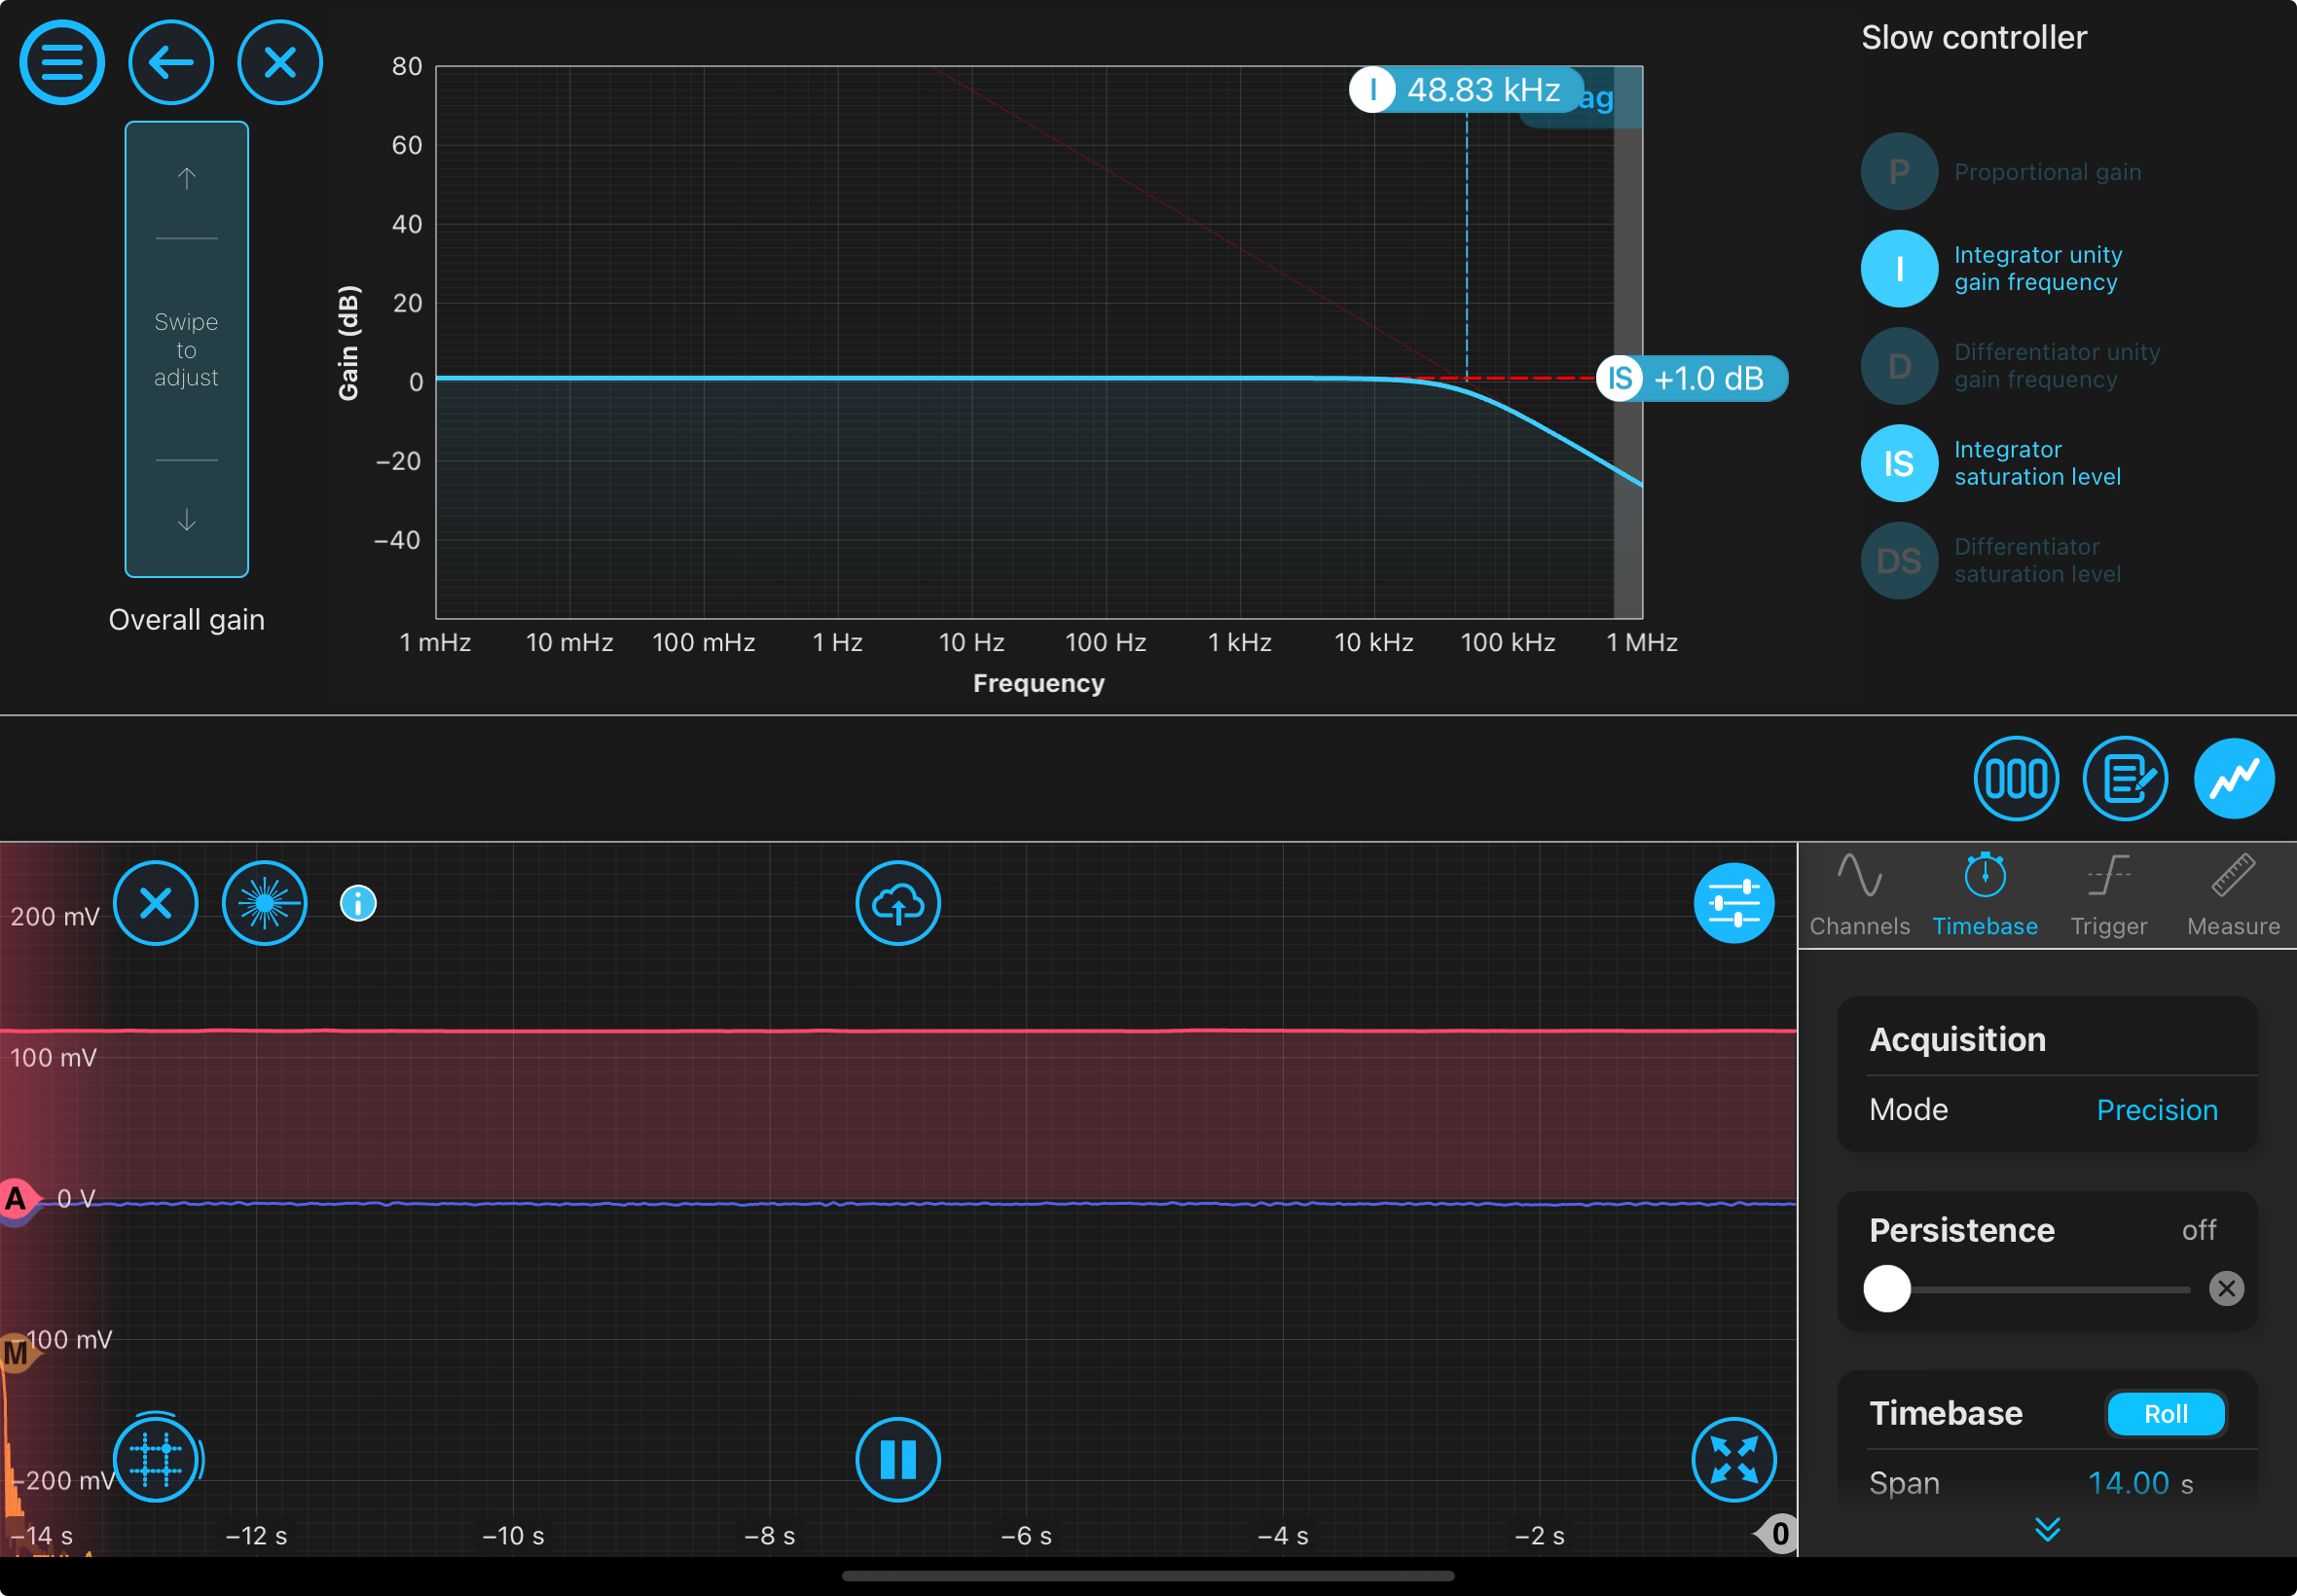
At low unity gain frequency, there is overlap: low_unity_freq_psd_comparison.png. As a note, there is a peak at 60 Hz, which I would guess is AC line noise. I was able to get the integrator unity gain frequency to 48.83 kHz (with integrator saturation level of +1.0 dB). The way I am verifying that the controller actually is controlling is ensuring that when I close the switch for control, the photodetector signal does not decrease (moving towards the absorption dip minimum) and the error signal increases. This was the case for when I had the 48.83 kHz integrator unity gain frequency, this picture shows when I broke and reconnected the controller: seemslocked.png. At this higher frequency, we would expect the reduction in noise when locked to be lower. This is unfortunately not the case, the two noise spectra essentially overlap: higher_unity_freq_psd_comparison.png. If we plot the difference between the locked/unlocked PSD (really it is an amplitude spectral density based on the units, PSD would be that squared), there is not a significant difference: Difference.png. The reason for different "levels" of spikness in different section of this graph is becauseI took measurements of the power spectra into three sections: 0Hz to 1 kHz, 1 kHz to 100 kHz. 100 kHz to 1 MHz to get sufficient resolution. The controller for hte higher frequency is shown here: controllerconfig.png.
I think the individual frequency spectra makes sense. I think we should not be using differentials (unlike what Torrey had done, see his log post 2/21/2024) because that was converting a bandwidth of some wavelength amount to that same width in frequency. When we convert from the wavelength to frequency axis, we are just converting a singular value of wavelength to frequency (no distances). The order of magnitude should be around 10^6 Hz/sqrt(Hz), not what I originally thought should be 10^-6 Hz/sqrt(Hz).
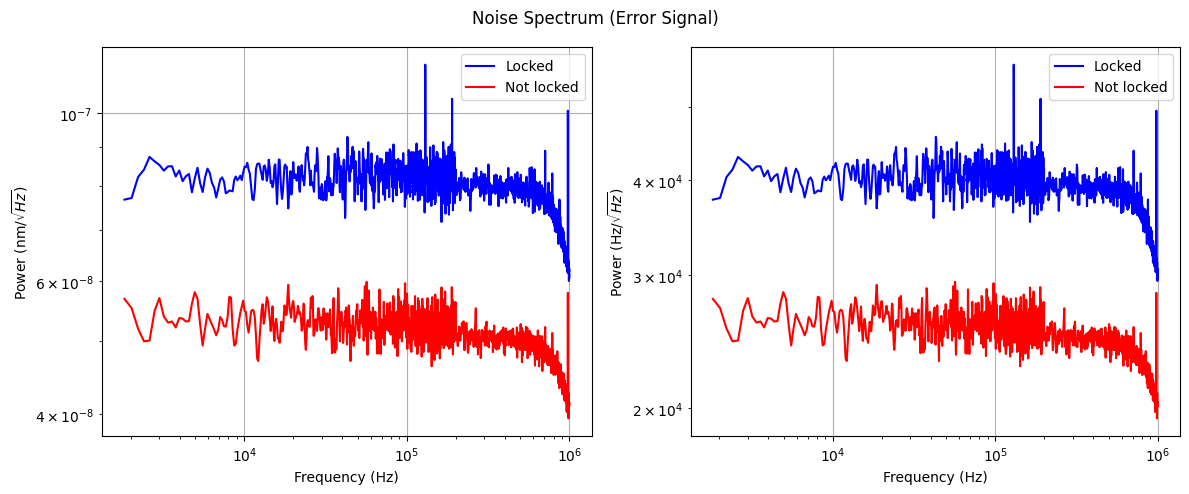
If we look at the spectrum of the error signal, it seems like the unlocked error signal has less noise than the locked one: spectrum_error_signal.png. I am not sure if this is extremely concerning because this just shows the amount of noise in the error signal. But wouldn't we care more about the noise in the actual signal (photodetector?), which tells us more about how our plant? I am not sure if this argument makes sense since the error signal is really just a low-pass filtered version of the photodetector signal.
As far as I know, there are 3 ways to produce the noise spectrum: 1). Use the Moku built-in spectrum analyzer, 2). Use the built-in math channel on the laser lock box and set it to take an FFT, 3). Take a timeseries of the photodetector/error signal and then do an FFT in post processing. The three differ in units and potentially in windowing aka ensuring the ends of the measured signal go to zero at the ends (this would be mainly be the case with the spectrum analyzer). I have not been successful in getting all three to agree yet.
Anyways, the main issue is that the there is no distinction between the noise level of the locked/unlocked spectra seem to overlap, even at higher unity gain bandwidths. Some thoughts:
- Is this some fundamental issue with the lock? Don't think so. I had also thought that the way I was taking data after unlocking the laser (at the same resonant frequency) might be a problem but I can't think of why since once the controller is not connected to the system, the laser would be free-running.
- Is the temperature controller not sensitive enough for the error signal changes? Highly doubt it because the amplitude of the scan when locked is not 1 mV, tends to be 19 mV ish, so there should be some wiggle room for the temperature controller to adjust accordingly with the error signal.
- Can intensity noise from the laser be dominating (relation to the polarizing maintaining fiber causing power to change)? The timescale seems too short for this to happen. Also, is the calibration using the slope canceling out intensity noise? Don't think so.
On the bright side we should be able to lock at higher frequencies than before. Couldn't get the fast controller to lock, will try tomorrow.