[Jeff, Sander, Torrey]
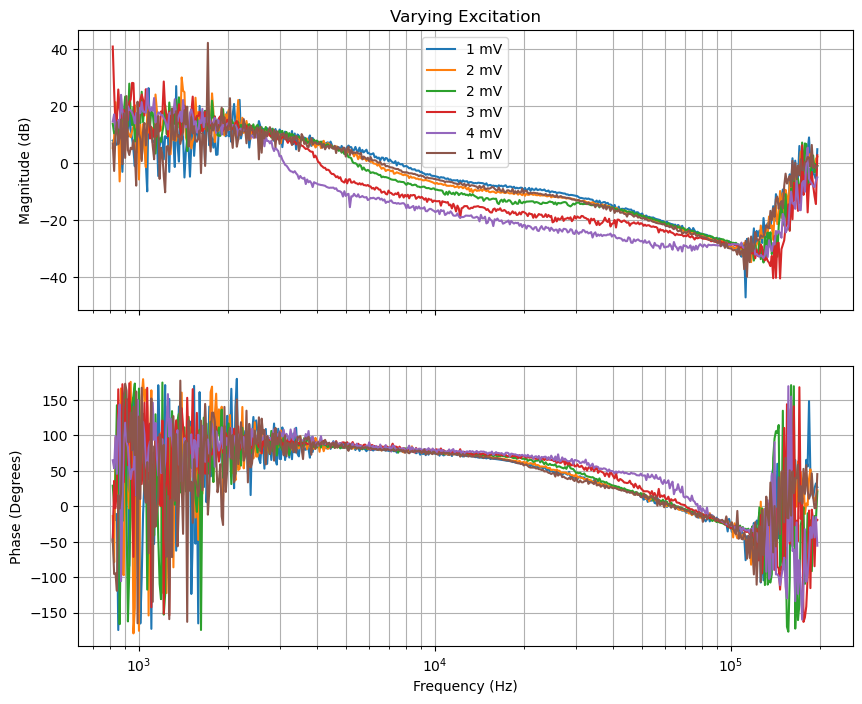
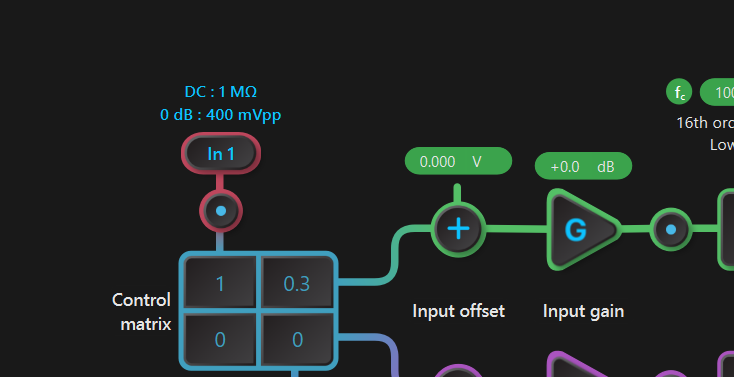
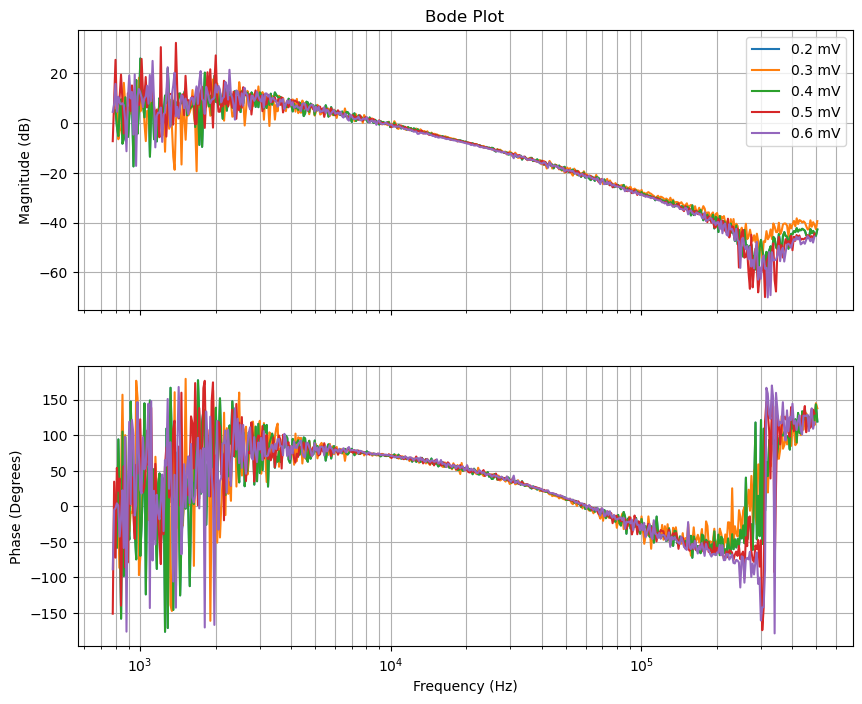
We set out to get transfer functions and noise spectra to try and diagnose the poor locking quality of the OFCs. We starting out testing how the excitation strength effected the TF. We found that anything above 1 mV (which is the minimum excitation strength) yields different results, implying this is too strong of an excitation strength. To get around this, you can add an attenuation in the digital filter box that is being used to mix the excitation signal and control signal. We confirmed this worked by recording the same TFs at different excitation voltages below 1 mV using this strategy: below1mVexcitation.png. All this to say we need to be careful about too much of an excitation signal when taking the following TFs. This is slightly problematic as at low frequency we are basically just measuring noise.
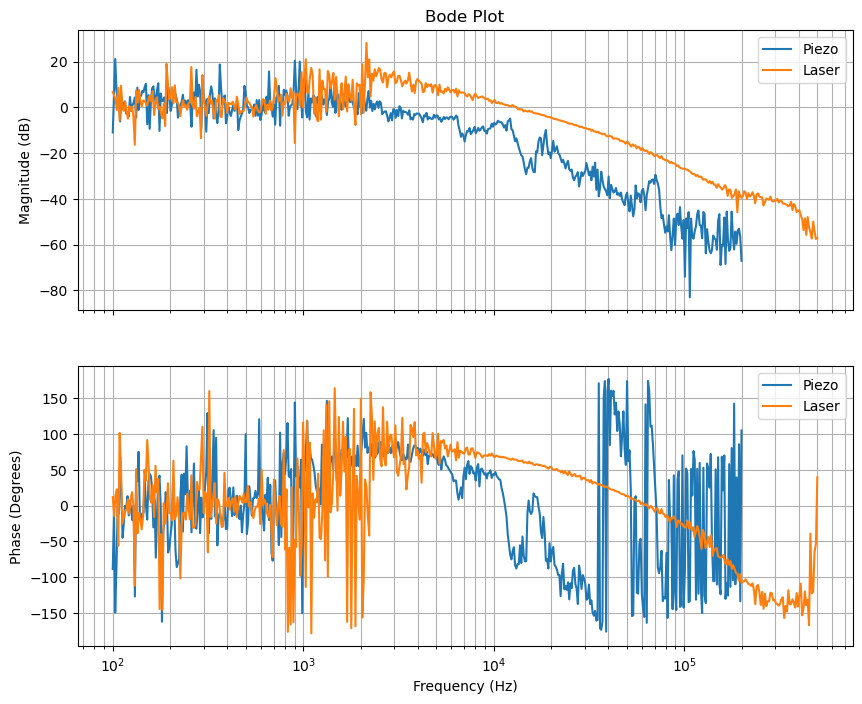
Next we take careful TFs of the OLG while the cavity is locked, with the piezo and (teraxion) laser individually. A few different notes from this result. First, below 2kHz is just noise, ignore this region. As Lee has alluded to in the past, we can approximate the fast controller as the shape of this TF at low frequencies. I have code to do this if we want this but am just showing the quick plot for now. Above 2 kHz we can see the piezo resonance around 13 kHz as well as a steep drop off in the phase after this.
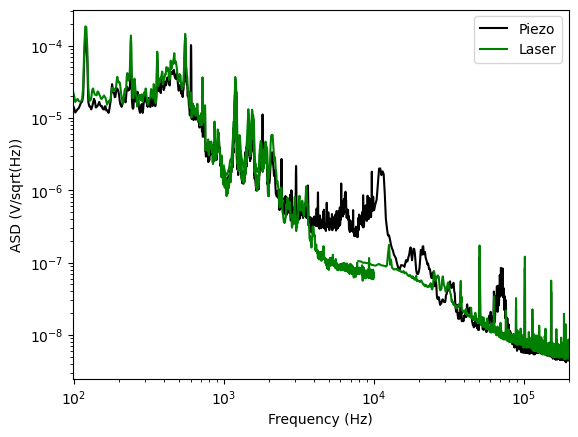
Additionally, we have a plot of the noise spectra for each case. This shows a large peak where we think the piezo resonance is. Interestingly, it shows almost the exact same noise below this feature. Small note of the disconnect in the data around 10kHz. We took this data in smaller windows to get more detail in the noise spectra. Unsure why this disconnect happened.
A few other notes: The controller shape while taking this data for the piezo and laser was a pure integrater with a UGF of 40 and 100 Hz respectively. These transfer functions and noise spectra were taken using similar multi-instrument mode in the past. The data for these can be found at "\Nextcloud\GQuEST\Measurement Data\Feb4 Teraxion TF\".
We'd like to discuss with the group on next steps.