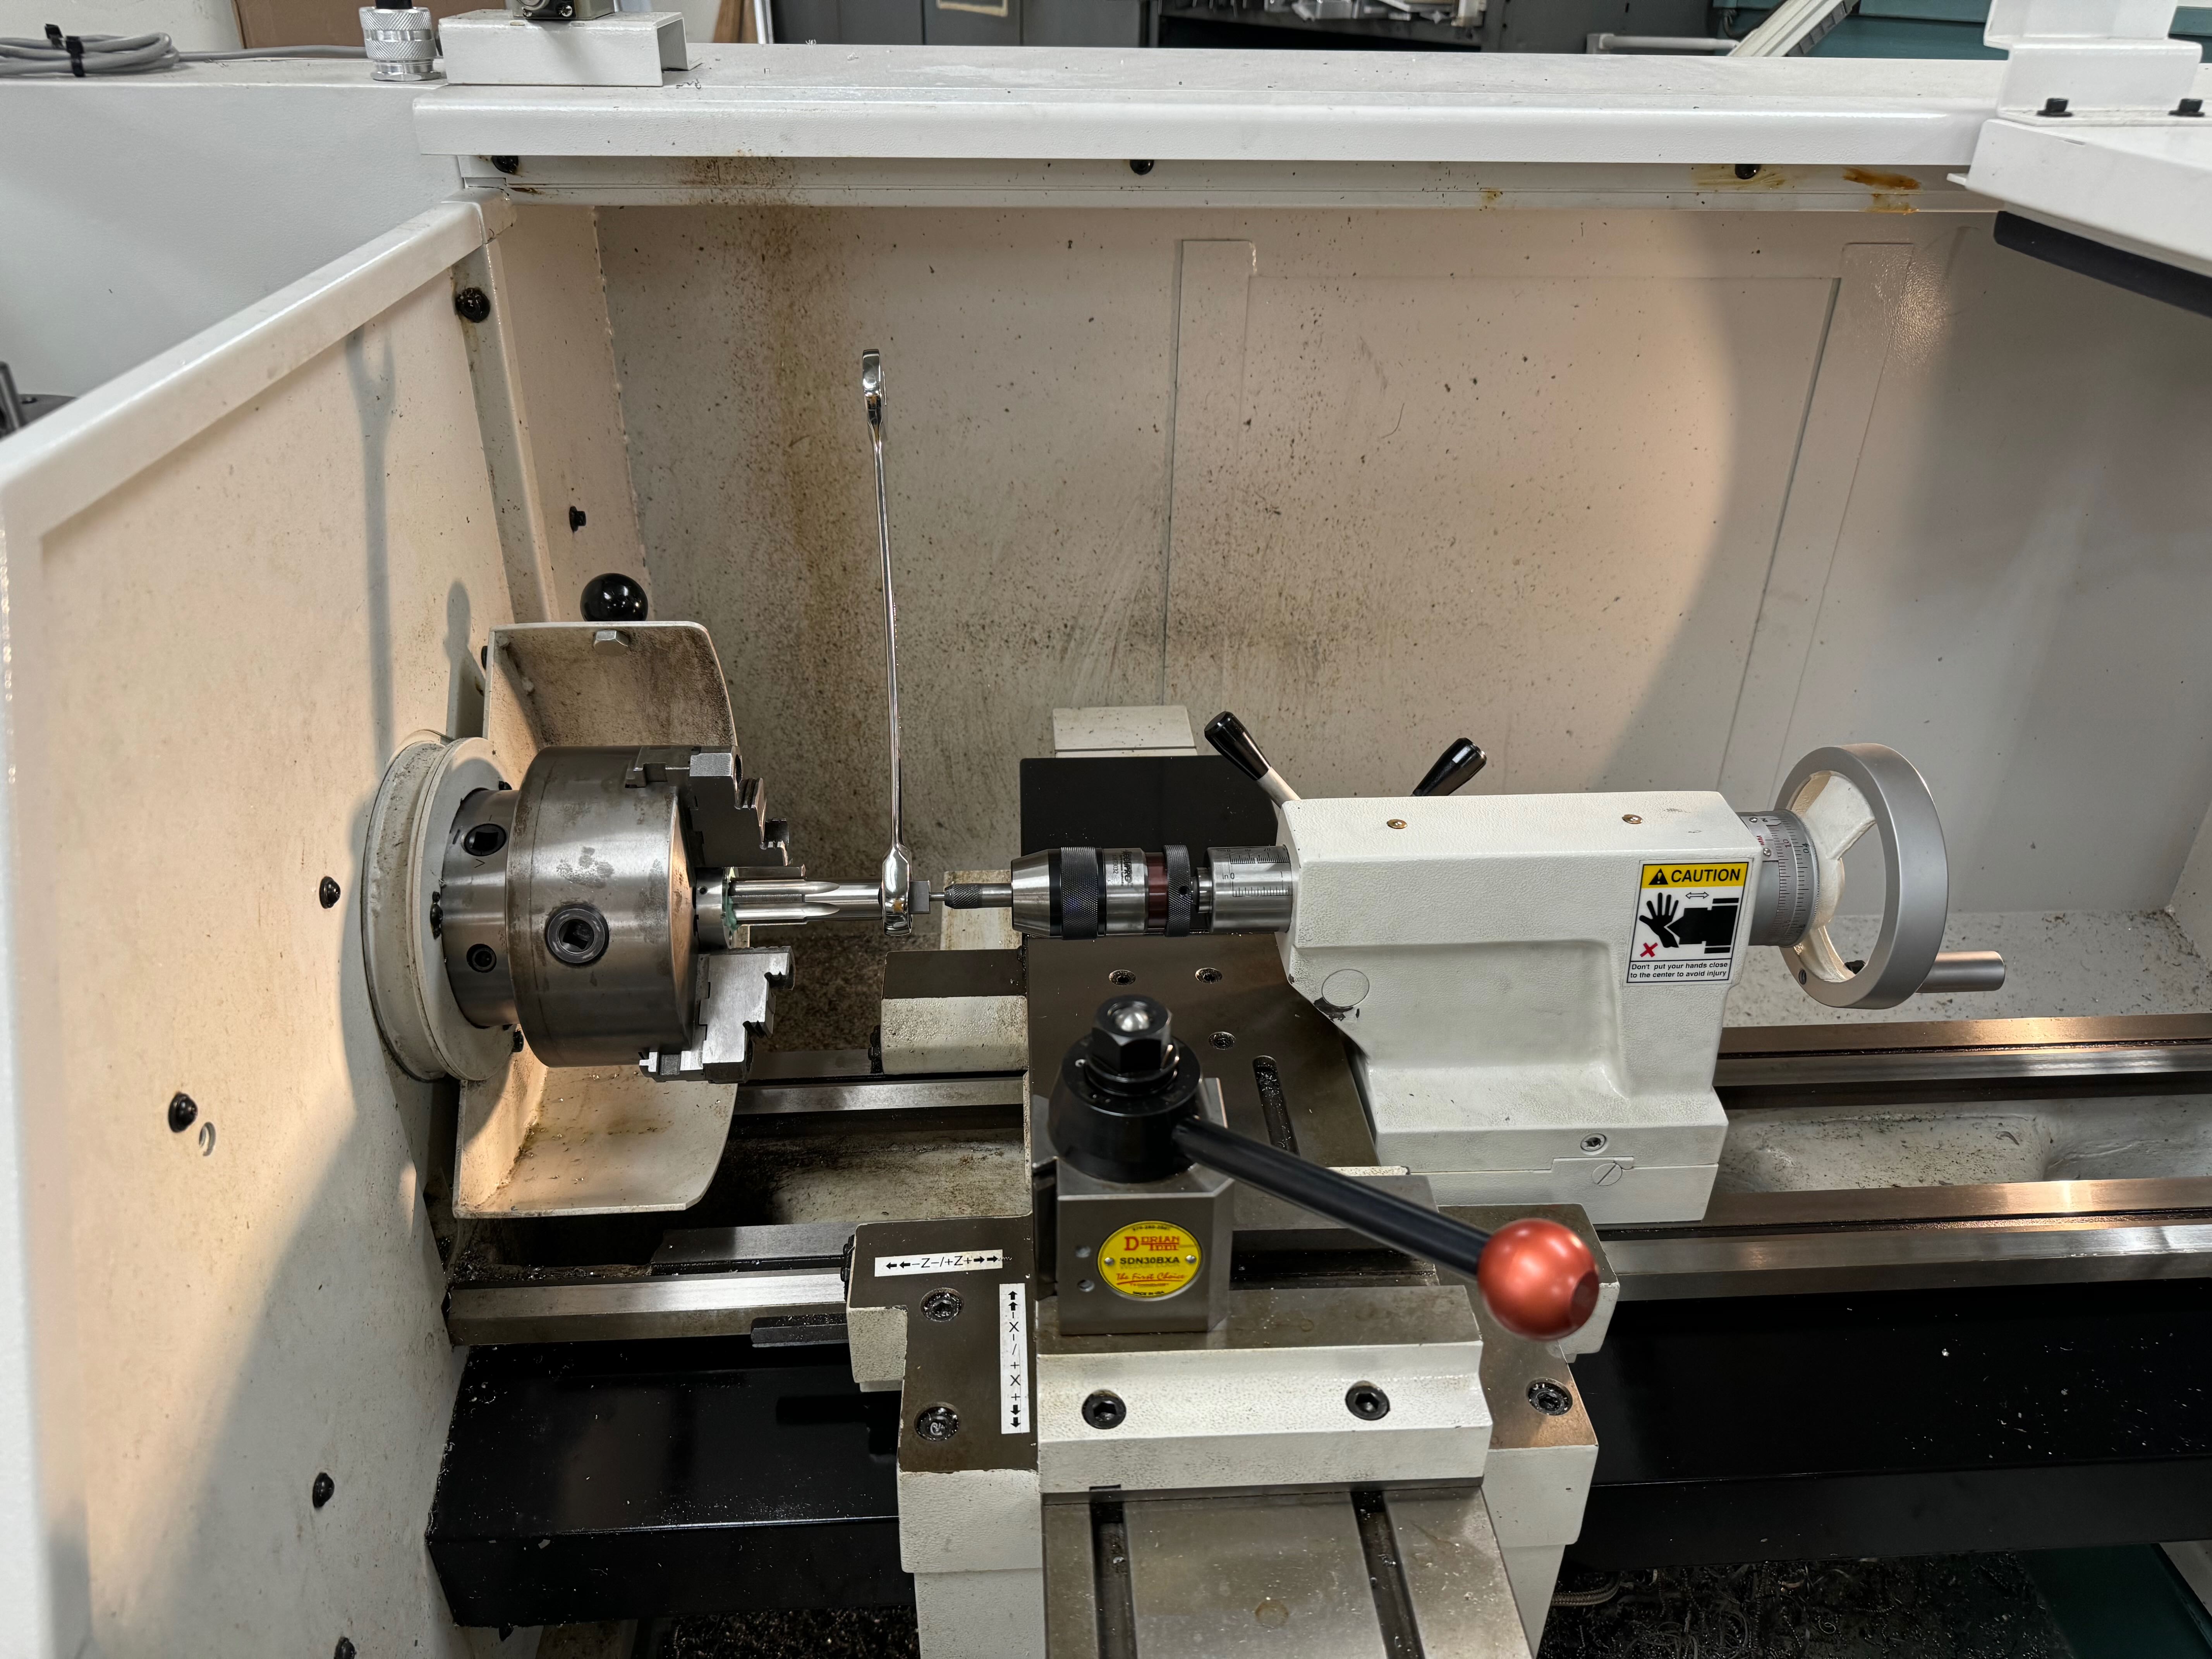
From the last comment on https://mccullerlab.com/logs/lab/index.php?callRep=11650 we can clearly see some additional process decaying at the tail end of the cavity ringdown measurement. Attached is a screenshot of a quick check I performed where I repeat the cavity ringdown measurement process with no cavity. This is pure reflection from the input coupler. Attached is a screenshot of triggering on the decay. There are three distinct time frames:
1) -375.4 ns to -294.2 ns - This is the first moment where the total light on the PD is changing. Note that this portion is flatter than the following one. Probably some initial slow process on the AOM. This looks like the AOM is slowly becoming less efficient immediately after the power is cut.
2) -294.2 to -234.2 ns - Rapid decay of light on the photo detector. This could be the light travel time? 60 nanoseconds is order of magnitude how long the light is taking to travel to the PD (don't know the exact refractive index of the fiber).
3) -234.2 ns and on - This is the same shape as the tail end of the cavity ringdown measurement. This seems like some residual voltage produced by the PD on short timescales.
Also note that we don't see the large blip that is in every cavity ringdown measurement perhaps suggesting it is not from the AOM but some interaction with the cavity.
[Torrey, Daniel]
I connected the 10 MHz Reference In on Moku 1 to 10 MHz Reference Out on Moku 4 with a bnc (not a homemade additional shielded cable). When turning on the EOM drives to the 775 nm light EOM and the 1550 nm light EOM, one from each iPad, we don't observe a sine wave modulation around 11 Hz like we did in this post. If we shift the frequency of the EOM drive on one Moku, we can see the sine wave.
The Moku Website says to "ensure 'always use internal reference' is disabled", but we did not find this setting. The third (right-most) LED on Moku 1 indicating there is a reference input is blue. Considering this LED is lit up and the 11 Hz sine wave went away but is recoverable by intentionally changing the frequencies away from each other, I am assuming this setting does not need to be changed.
Here's a proposal for a layout for the first parts of the experiment in the new lab space (attached). The plan was to have space for an in-air prototype Michelson, and simultaneously have space for building up a power-recycled IFO, with both connectable to the photon counting readout, and hopefully minimise movements of components in moving to later stages of the experiment. The power-distribution, SHG, and input laser breadboards are intended to go either on shelves above the benches or a bench in the other lab. Layouts within individual breadboards are rough drafts. Let me know what you think.
In preparation for an adaptive scheme for filter cavity controls using buzz, I've written a jupyter notebook to lock the cavity, take a transfer function, and perform system identification using tools from wield.
Attatched are some plots of the cavity open loop transfer function, the controller, and the plant model with different scan amplitudes. They all used the 'dynamic amplitude' mode on the moku
[Torrey, Ian]
We had attempted to make a cavity ringdown measurement in the past unsuccessfully (never posted on the log). Here we show a successful measurement. Key difference to past attempts were the TRANS pd we originally used were low bandwidth (BW<550kHz) where the time scales being measured are on the order of megahertz. Previously we also used the FSR of the 1550 light instead of the 775 light, which is just a factor of 2.
Here is the new attempt. Changed the measurement PD to the 1811 REFL PD to DC coupling and adjust error signal set point and PID controller so that you can lock the cavity with the much higher bandwidth PD on DC coupling (DC coupling the PD reduces the error amplitude). We lock the cavity with the 775 light using this method and then change the trigger mode on the moku to decaying edge and set the threshold underneath the lock point. We then use the AOM as a "fast shutter" of the light going to the cavity simply by turning off the amplified RF drive going to the AOM. This should be a sufficiently fast "blocking" of the light going to the filter cavity. We see a decay.png in the cavity by doing this. I then wrote a quick script to fit a decaying exponential to the data and calculate the finesse from this where the finesse will be F = 2*pi*FSR*tau = 2*pi*(3e8/2.4)/2*tau (from here tau * cavity bandwidth = 1/(2*pi)).
How good the fit is depends largly on the portion of the data used, where the tailing end of it does not seem to be exponential. For example:
If we use this much of the data decay-overlay.png, the fit looks like decay-fit.png (decay-overlay.png). This yields a finesse of 389.
If we use only the portion of the data that looks like an exponential (the end of it looks linear,not sure why) decay-data-used2.png, the fit is much better decay-fit2.png/decay-overlay2.png and we get a finesse of 303.
The finesse should be 313, see post [11633], based on the reflectivities of the mirrors. Further analysis is needed but I think we can constrain the measured finesse to between 389-303.
A potential source of error in this measurement could be the fact that the 775 light has a ghost beam, see attached.
I think Sander asked in the meeting about how the number indices used in the fit effects the value/standard deviation of the calculated finesse. Attached is the finesse according to this ringdown as a function of number of indices used in curve fit, as well as error bars with +/- 1 standard deviation ( finesse_indice_cutoff_full_view.png and finesse_indice_cutoff.png). Green points have our expected finesse within 1 standard deviation, as calculated from the reflectivities of the mirror. Not sure how accurate a data point where the finesse falls in the bottom half of +/- 1 std is as we should never expect to accidentally have better mirrors than the manufacturers measured specs.
The average of all green points is 306 compared to the expected value of 313.
There was also talk of the end of these points potentially decaying by an extra factor. I think this is confirmed in second_exponential_in_data.png, as the green curve fits very well to the tail end of this data. This also looks like whatever is causing the points making up the green fit are becoming the dominant factor around t = 0.
Fitting the decay measurement to a sum of exponential curves with different time constants yields a very good fit. It seems there is an additional decay process in this measurement, most likely electronic.
[Daniel, Torrey]
Talking with Sander this morning he pointed out that the amount of power on the 1550 camera from both beams should be approximately the same. Attached pics with the camera show that while locked on 775 and attenuating 1550 light, and blocking the 1550 beam, the majority of light is 775 leaking through. This was done for 2.2 mW input power for 1550. I have increased the power to 15.7 mW input for 1550 so that the amount of leakage of 775 through the mirror will be negligible.
Below are a brief description of each image.
With these measurements and this script I'm getting 8 * 10^4 suppression. I think the low power measurement method needs to be improved for this to be reliable.
The thorlabs NENIR20A-C 2.0 ND filter is actually rated for 1.91 @ 1550 nm. This adjusts it to 7 * 10 ^ 4 suppression. This also makes the two methods of fitting a saturated Gaussian and fitted a Gaussian to the filtered beam very consistant.
Accounting for the 775 light that is leaking through the 1550 HR mirror I am getting closer to 3 * 10^5 suppression of the 1550 light. This is a very rough subtraction method. I am going to increase the power to the 1550 path as much as possible now that I have a clean ND filter and the saturation method working so that the amount of 775 light will be negligible. at 15.7 mW input it is not.
-1550 increased to 57 mW input. Only increase to be gained from here is amplifier pump current.
-Redo high and low power transmission pictures.
-Additionally i've set up a flip mount with an ND filter on the 1550 camera path. Please refer to 11370 on how to controll them. The physical button is on the bottom left corner of the breadboard.
These values above yield ~2 * 10^5 suppression.
This is an update to 11401. I have been looking for an accurate way to measure the amount of power exiting the cavity when the cavity is locked with 775 but in the configuration that attenuates 1550 light. This is easy when the beam is wellbehaved.png. However because there is a massive difference in powers we need to measure in the two configurations, we must either turn the power way up so that we can measure the attenuated beam, and struggle with the saturated coresonant beam. Or, turn the power way down and easily measure the coresonant beam but struggle with the attenuated beam. This script should solve the former, where I have applied a mask to the data array that makes up the camera data, getting rid of any saturating data and then fitting to that portion of the data instead, seen here: saturated_solved.png.
I am still looking into a proper way to sum these values without getting the background light. There may also be some pick up of the 775 light on the 1550 camera in the low power setting as the expected amount of light from both should be order nanowatts. I am going to retake these pictures (and remember to write down the exposures) now and will update.
The attached Jupyter notebook will do the following:
-Set up our 'standard' multiinstument setup, with laser lock box, frequency response analyzer, digital filter box, and spectrum analyzer
-Configure the digital filter box to perform a sum and all-pass filter
-Configure the laser lock box to perform a sweep of the laser frequency and record the transmission and PDH error signal
- Find the voltage at which the transmission is maximized
-Set the offset to that voltage
-turn off the scan
-turn on the controller
It locks! You may have to run the bottom of the script repeatedly in order to aquire lock, but it hits eventually. Lock is lost if you attempt the handover to the iPad, but can be quickly reacquired.
[Daniel, Sander, Torrey]
We have taken input, trans, and reflected powers for the cavity at both wavelengths. This is done by locking the cavity with one wavelength and then measuring the respective powers of the other. Additionally when doing the 1550 nm light measurements you have to tune the AOM RF drive frequency so that the 1550 transmission/reflection is maximized/minimized. The results are as follows:
1550 nm
775 nm
[Daniel, Sander, Torrey]
Attemped to measure the amount of power suppression the cavity is providing for the 1550 path. Plan was to use a camera, take a pic, fit a gaussian to the beam, then integrate to get total power. Do this for both beams without having to calibrate into units of power we could get a relative suppression via the ratio. THe problem is there is too much power when the modes align, as the camera saturates. And the 1550 ND filters we have are dirty. I attempted it with the power meter and got the following transmission values:
.550 mW When the two modes are maximally coresonant.
9 nW When the two modes are minimally coresonant. (blocking the 1550 beam reduces the reading down to the background level)
7 nW Background.
If we believe this very crude measurement this is a suppression factor of 2.75 * 10^5.
If the transmitted beam were a TEM00 mode in both cases (which I doubt based on the camera), this would imply a finesse of
\[ \mathcal{F} = \frac{\pi}{2} \sqrt{S} = 820\]
Where S is the supression factor, S>1.
The AOM frequency may not have been correctly maximizing the cavity transmission here.