Displaying reports 801-820 of 1093.Go to page Start 37 38 39 40 41 42 43 44 45 End
Reports until 17:00, Thursday 29 February 2024
Lasers General (GQuEST)
Daniel Grass - posted 17:00, Thursday 29 February 2024 (11496)
Thermal Lensing Notebook

Attached is a notebook to calculate the thermal lensing in a michelson interferometer.

Non-image files attached to this report
GQuEST Output Filter Cavities
Torrey Cullen - posted 11:00, Thursday 29 February 2024 - last comment - 14:32, Tuesday 09 April 2024(11495)
Calculating cavity piezo

Update to 11481

Improved how the cavity bandwidth is calculated and cleaned everything up. Attached is the python notebook used to calculate this. Data can be found in \Nextcloud\GQuEST\B102\Output Filter Cavity\Cavity Piezo Calculations\cav_piezo_data\ . The associated spectra is also in this directory. These plots now show the piezo TF for the PA44M3KW glued to a mirror and in daniels compressed design, PA44LEW (small thorlabs piezo), and cylindrical Noliac piezo.

Images attached to this report
Non-image files attached to this report
Comments related to this report
Torrey Cullen - 14:32, Tuesday 09 April 2024 (11524)

Update with phase information. Unwrapped and rolling averages applied.

Images attached to this comment
GQuEST Output Filter Cavities
Torrey Cullen - posted 16:23, Wednesday 28 February 2024 (11494)
auto set up of useful moku configurations

cavity_piezo_transfer_function_setup.py and lock_and_TF.py will create the required moku configurations in 11481 and 11449 respectively. Note that until this is resolved, you must put output3 in the correct spot manually, as well as configure output3 settings manually.

Non-image files attached to this report
Controls General
Torrey Cullen - posted 22:31, Tuesday 27 February 2024 (11491)
Probable Glitch in Moku Software

Found a glitch in the moku I think people should be aware of.

I don't know what causes it but there have been multiple instances where the moku thinks its outputing the correct voltage but there is no signal coming out of the output port. Ex: While measuring several transfer functions today, I measured a TF with and without the high voltage amplifier (same set up as 11481). I took a TF using the high voltage amplifier, unpluged both BNCs from the HVA, connected them in order to bypass it, and went back to take the transfer function. Functionally nothing should change when doing this but when I attempted it, the transfer function was garbage. I eventually realized that even though it said there was an excitation signal on, nothing was actually coming out of the output (confirmed with a volt meter and oscilliscope). You even see the proper voltage at the closest test point to the output, but still no signal actually coming out of the output. Closing the moku app and reopening it did not fix it. Exiting out of the multi-instrument mode, opening up any random function in single instrument mode (I opened the oscilliscope), and opening MIM again fixed the issue.

Just putting this here in case people encounter this bug. Or maybe if anyone has an explanation for this please feel free to comment below. This may be worth a moku instruments forum post as well.

Lasers Laser Filter Cavity (GQuEST)
Daniel Grass - posted 16:53, Tuesday 27 February 2024 (11490)
Looking at the Inside of the End Cubes for the Laser Filter Cavity

[Torrey, Ian, Lee, Daniel]

We cleaned the end cubes (which are in B102) with a clean room wipe and isopropanol since I there was some residual grime from my cleaning in B150 (or it was introduced after I cleaned, maybe during the move). We then took the top of the end cubes off and looked at the inside to look for the internal hole pattern on the bottom flange. In the SolidWorks model, they had 4 #10-32 tapped holes. Unfortunately, one cube has no holes and the other cubes has just one hole (see attached photos). One of the bend cubes (in B150) has a flange taken off and covered in foil, so I went to check the inside of that cube. I couldn't see the bottom since a mirror base was still in the cube.

In order to hold the mounts for the Laser Filter Cavity mirrors, we have 3 options. The first is to buy a new bottom flange with tapped holes. I couldn't find this product, but I did ask ~6 companies if it exists.

The second option is to machine holes ourselves. I think I could do this myself or we could pay someone to do it.

The third option is a more creative solution from Lee to hold a 6" diameter circular breadboard with friction. I don't love this idea because it's inevitably going to come lose.

Images attached to this report
GQuEST Output Filter Cavities
Ian MacMillan - posted 14:56, Tuesday 27 February 2024 (11489)
Modeling of the Attenuation of the Output Filter Cavities

I have revived my old finesse model of the four filter cavities to try to model the transfer function of power through the cavities.

cavity_modes.pdf (and the .png version) shows a single cavity with a laser going into it at 1550 nm while being phase modulated at 15.6 MHz. the cavity length is offset by 15.6 MHz. each peak is calculated individually and then combined where each peak represents an n,m mode. Since the Gouy phase of the cavity is about 120 degrees, only the third modes should get through. The heights of the modes have been given a per mode attenuation of  (1 / (m + n + 1)**2) and 0.001 times that for every non third mode. These values are arbitrary and will be updated in the future. This single cavity goes up to 5 TEM modes.

Work on this modeling is ongoing.

Images attached to this report
Non-image files attached to this report
GQuEST Output Filter Cavities
Torrey Cullen - posted 11:39, Tuesday 27 February 2024 - last comment - 11:27, Wednesday 28 February 2024(11488)
filter cavity notch + HV bypass

I attempted to improve the quality of lock on the output filter cavity using the piezo by simultaneously agressively notching 100dB at 3.5kHz - 5kHz using the digital filter box and also locking the cavity while bypassing the HV amplifier to the piezo. This can be done by scanning on the laser frequency but still engaging the slow lock. No visible improvements were made. The transfer functions showed a much more linear regime compared to those posted in 11449, but the UGF was still quite low (<1kHz). I can post the TFs if anyones curious but don't have them as of writing this.

Comments related to this report
Torrey Cullen - 11:27, Wednesday 28 February 2024 (11493)

IMG_0075.pngIMG_0076.pngIMG_0079.png are the same measurement with progressively more agressive filters, finally ending with IMG_0078.png. You can see the 4kHz resonance slowly being totally notched out.

Images attached to this comment
GQuEST Output Filter Cavities (GQuEST)
Daniel Grass - posted 10:27, Monday 26 February 2024 (11485)
Mechanical Self Resonance of an object with a uniform cross section

In order to see whether some of the resonances in the output filter cavities are due to a mechanical self resonance in the long axis, here is a simple calculation to see whether it's possible:

\[\omega = \sqrt{\frac{k}{m}} = \sqrt{\frac{EA/L}{\rho AL}} = \frac{1}{L} \sqrt{\frac{E}{\rho}} \]

\[f = \frac{\omega}{2\pi} = \frac{1}{2\pi L} \sqrt{\frac{E}{\rho}} = \frac{1}{2\pi \ 0.5 m} \sqrt{\frac{69 GPa}{2700 kg/m^3}} = 1600 Hz\]

Here, \omega is the angular frequency, k is the spring constant, m is the mass, E is Young's modulus, A is the cross sectional area, L is the length, \rho is the density, and f is the frequency.

It appears that the worst resonances in the cavity spectra are closer to 4 kHz, so either this is too simple a model or that resonance is due to something else.


Lasers Laser Filter Cavity (GQuEST)
Daniel Grass - posted 16:23, Friday 23 February 2024 - last comment - 13:18, Monday 26 February 2024(11484)
End Cubes for Laser Filter Cavity Moved to B102

[Ian, Torrey, Daniel]

We moved the 2 end cubes (not bend cubes) from B150 to B102. Since the end cubes bases have screws sticking out, they are resting on my custom base plates flipped upsidedown. The next steps are to take the bottoms off, put on my custom base, clean the insides, and move them to their final location. We will then start assembling the rest of the vacuum equipment for the LFC.

Images attached to this report
Comments related to this report
Daniel Grass - 13:18, Monday 26 February 2024 (11486)

We took a particle count measurment on Monday morning (3 days later), and there were no particles detected.

GQuEST General (GQuEST)
Daniel Grass - posted 11:13, Thursday 22 February 2024 - last comment - 11:54, Thursday 22 February 2024(11482)
High Frequency Bulk Acoustic Wave Noise Modeling with GWINC and COMSOL

[Lee, Daniel]

Lee has updated the model of bulk acoustic wave noise in GWINC (I believe to account more accurately for shear modes), but the results seem to indicate more bulk acoustic wave noise than the Holometer measured or I have modeled with COMSOL. Attached are 4 figures. The first is the measured Holometer data (fig 12.) The second is a plot from the GWINC model of the Holometer. The differences between the GQuEST model and Holometer model are arm length, laser wavelength, arm power, mirror size, mirror material, and mirror spot size. The Holometer end mirrors were modeled as 0.5" thick, 1" radius and the beamsplitter as 0.5" thick, 1.5" radius. Both were made from fused silica at 294 K. The beam size on the end mirrors is 5 mm. The calculated noise in GWINC is a maybe bit higher in this model, but it is fairly close.


I also did 2 COMSOL simulations with a 2 mm thick, 12 mm side length mirror with a beam waist of 2 mm with 1e6 Q Silicon. Both simulations had 14 mesh layers in the beam axis. For the first simulation, there were 42 mesh layers on each transverse side. For the second simulation, there were 84 mesh layers on each transverse side (making the mesh elements cubes). The minimum value of the graphs is nearly identical. Comparing the peaks is less meaningful because of aliasing due to the course frequency sampling of 100 kHz. The fact that the minima are so close implies that previous COMSOL simulations, which showed minimal noise from shear modes outside of certain peaks, were not limited by the transverse mesh density. Lee points out that the Krylov-space inversion solver might drop modes since it is a reduced-order solver. I am therefore running an eigenmode solver right now.

Images attached to this report
Non-image files attached to this report
Comments related to this report
Daniel Grass - 11:54, Thursday 22 February 2024 (11483)

Shown is an overlay of the GWINC model (orange) and the data (purple) for the Holometer. Around 1.8 MHz, the GWINC seems to not bottom out as low as the data. This 7th bin is GQuEST's peak signal frequency. At high frequencies, the GWINC model bottoms out more. I think this is due to coating thermal noise setting a higher noise floor in the Holometer data.

Non-image files attached to this comment
GQuEST Output Filter Cavities
Torrey Cullen - posted 17:24, Wednesday 21 February 2024 - last comment - 11:23, Wednesday 28 February 2024(11481)
Finding the cavity piezo transfer function

[Torrey, Ian, Daniel, Sander, Lee]

Introduction

We have been struggling for a while to figure out a configuration for a stable cavity lock using only the piezo mirrors. In an effort to troubleshoot, we want to take a transfer function of just the piezo (hp). We can't do this directly while the cavity is aligned and locked so we have to be a little clever about it. Below is a how we go about doing this.

Set up and methods

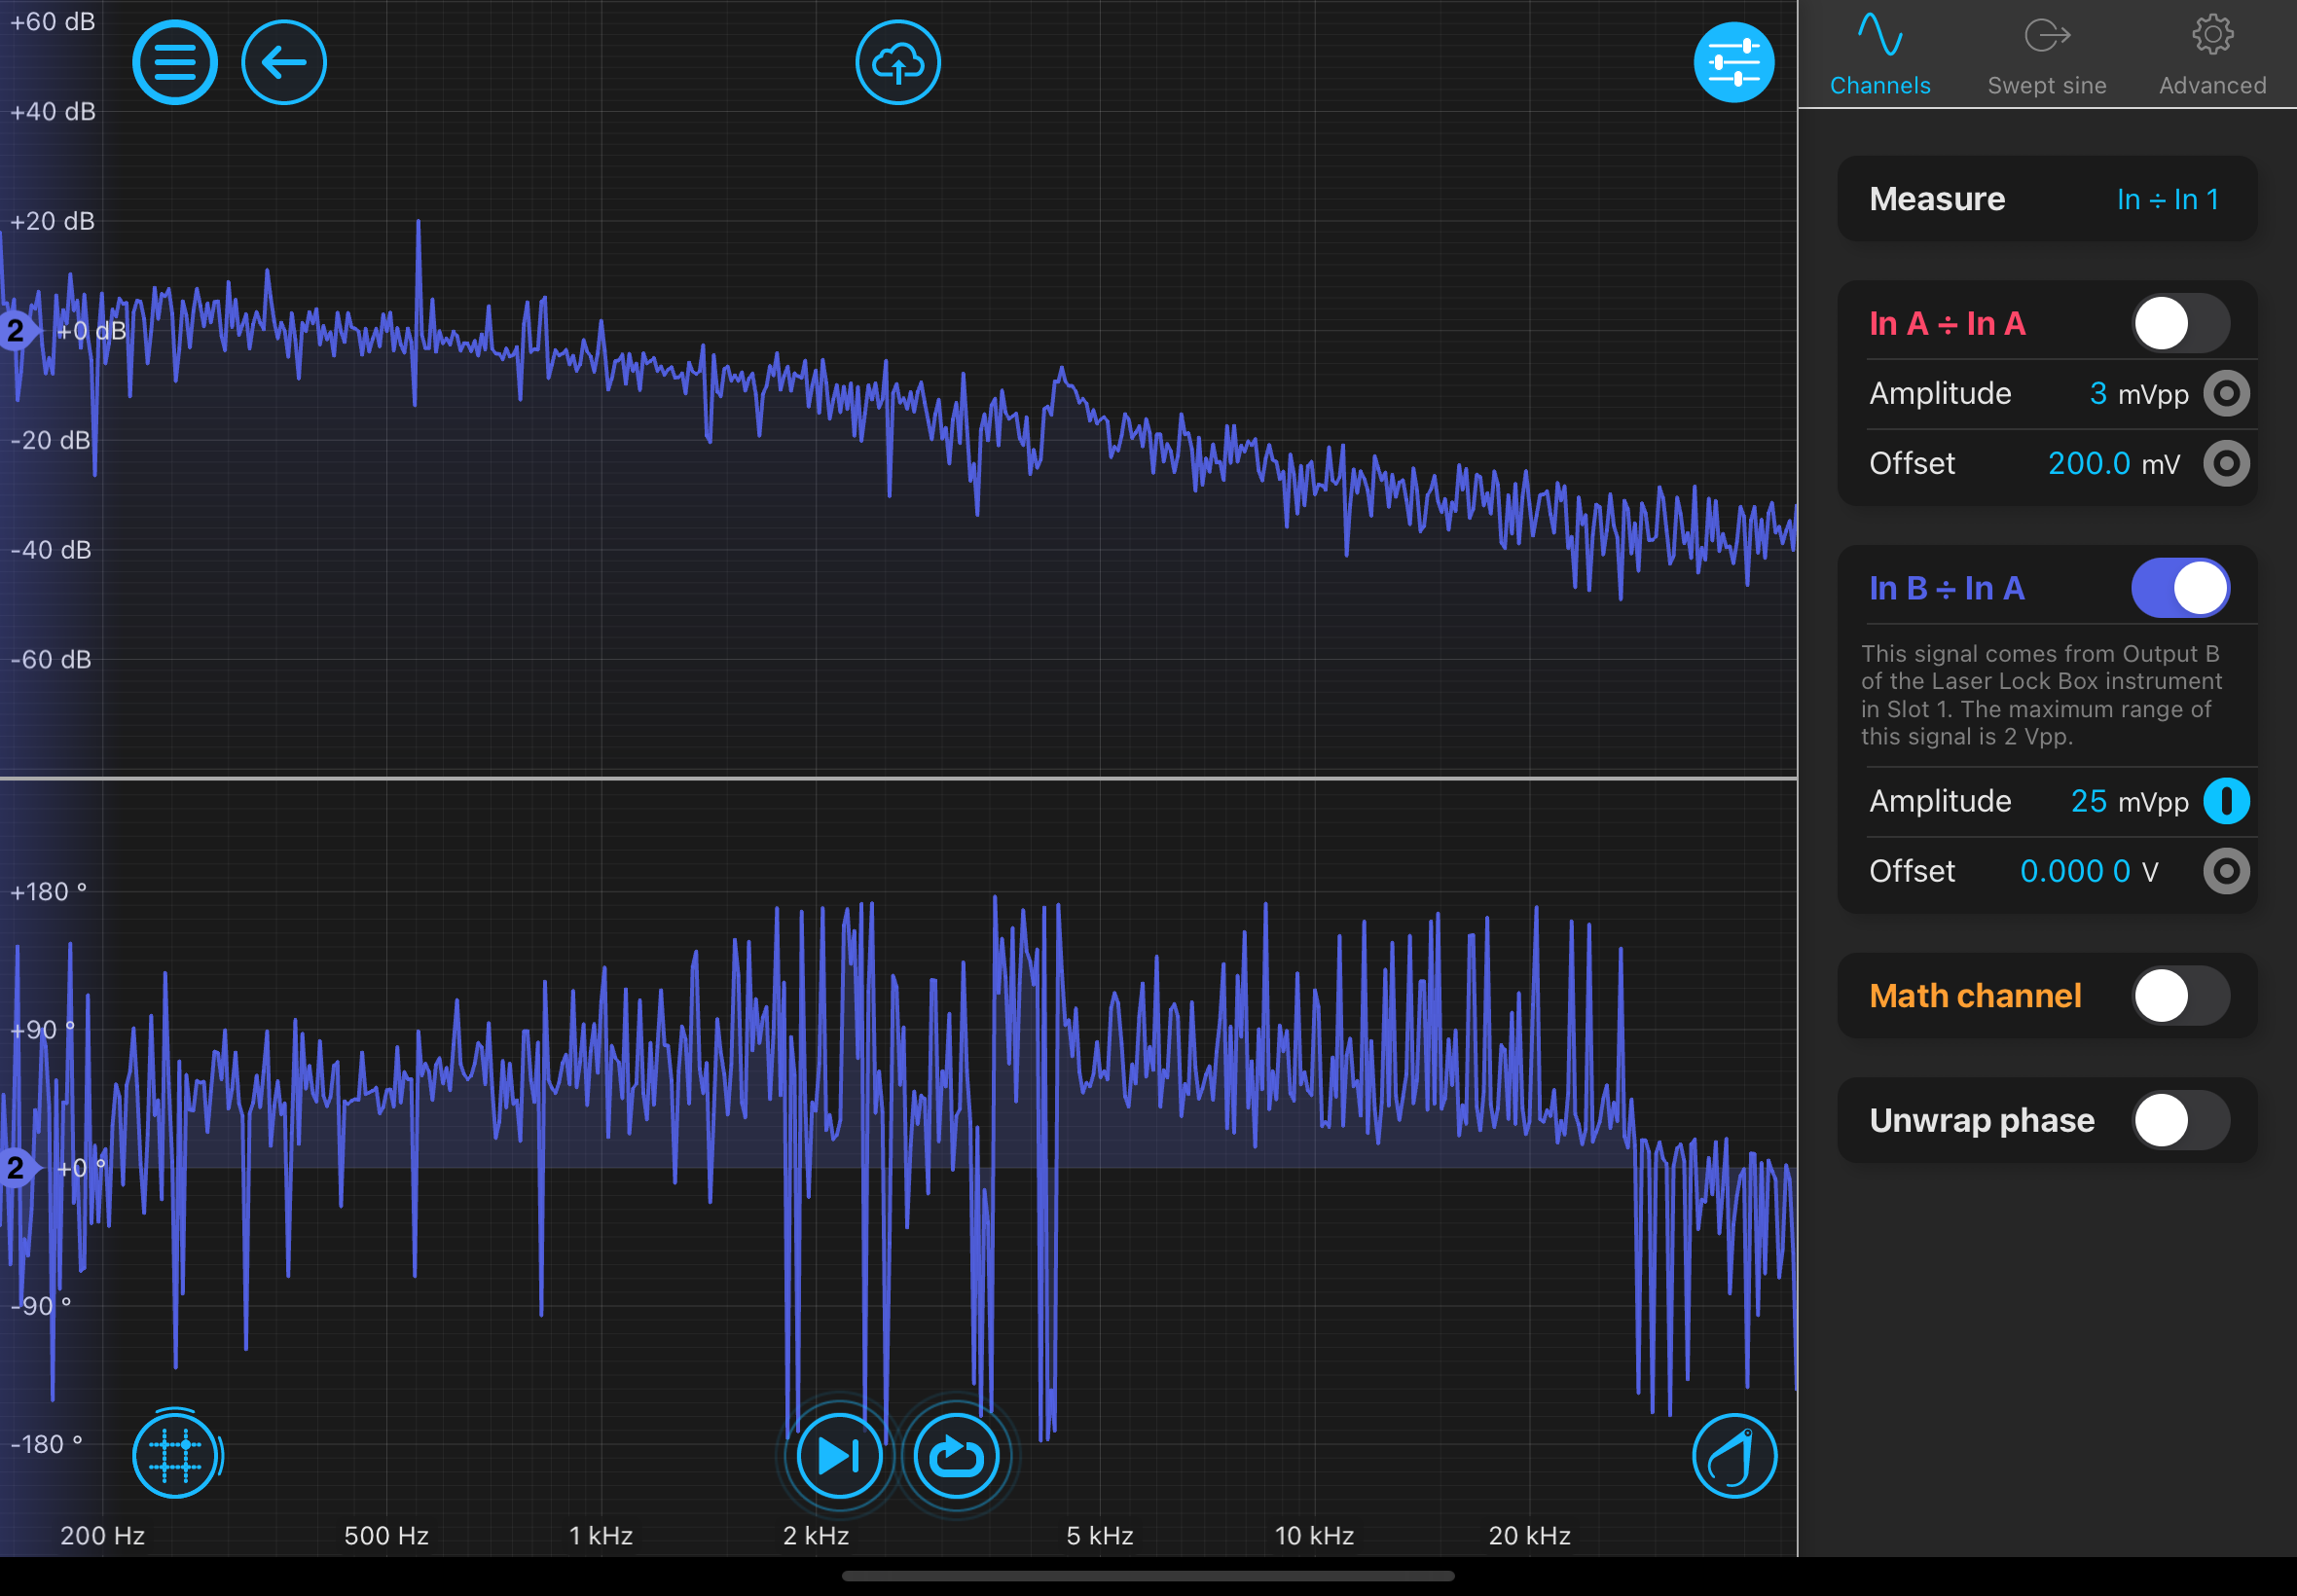
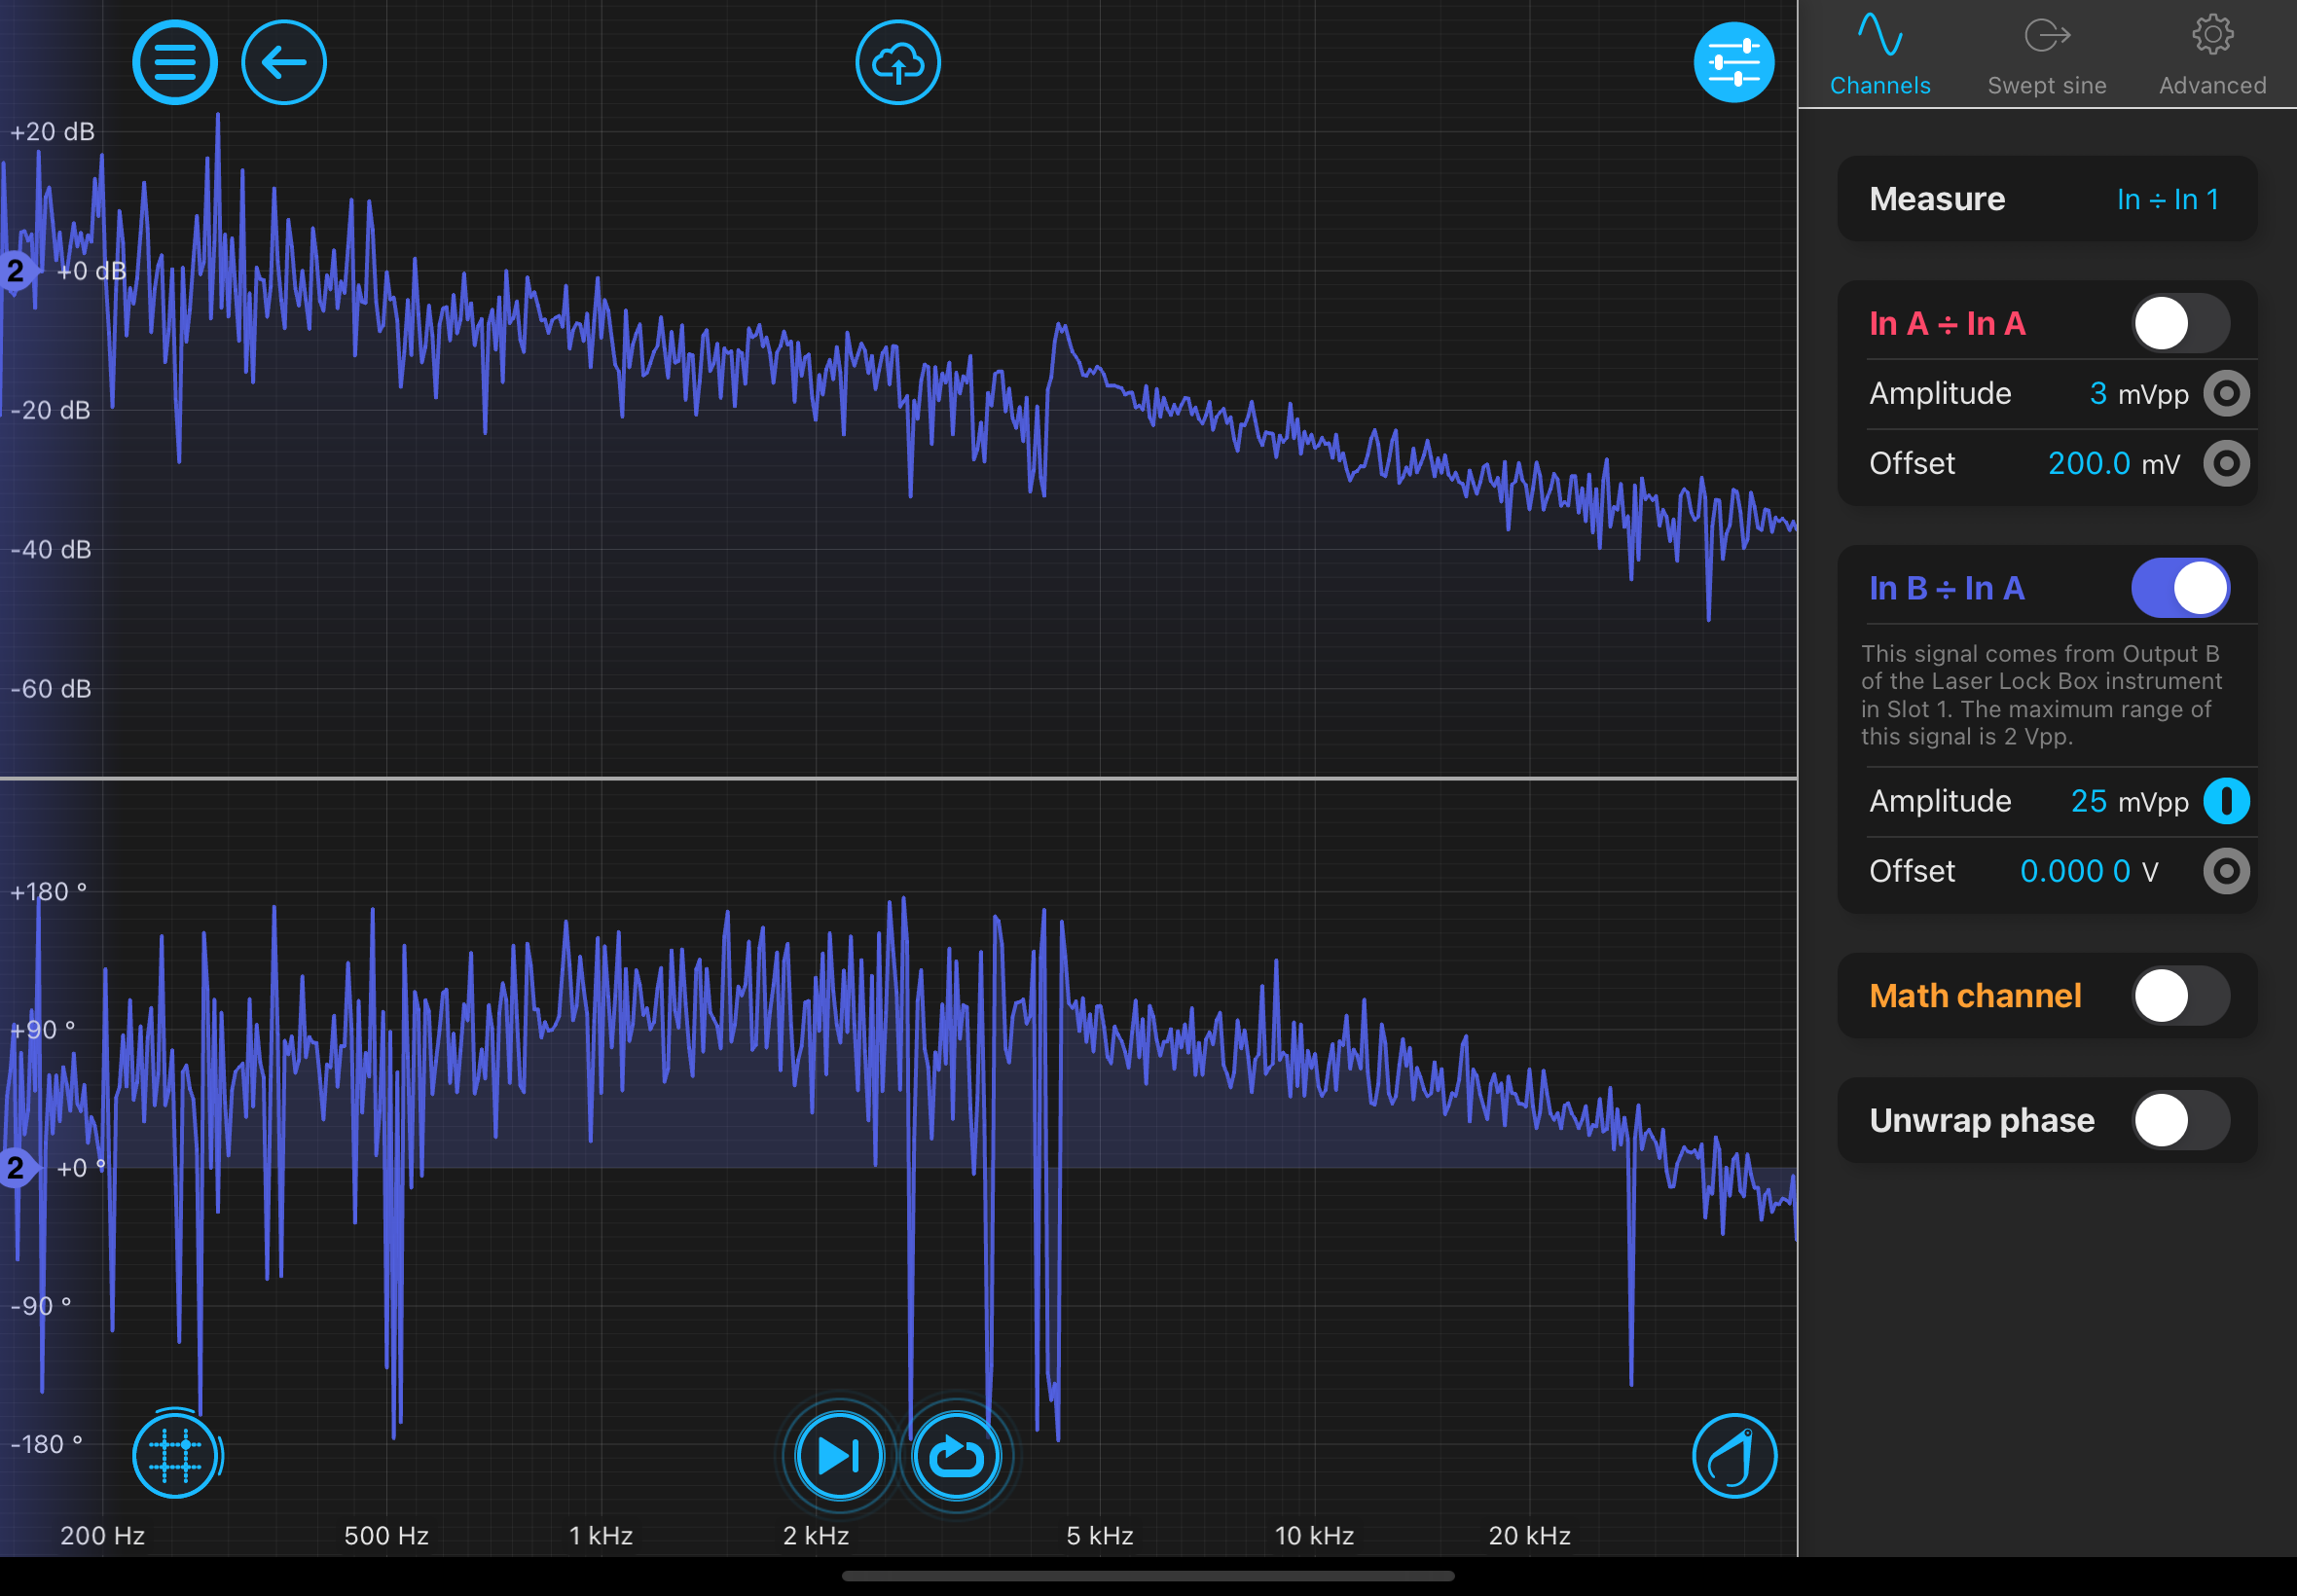
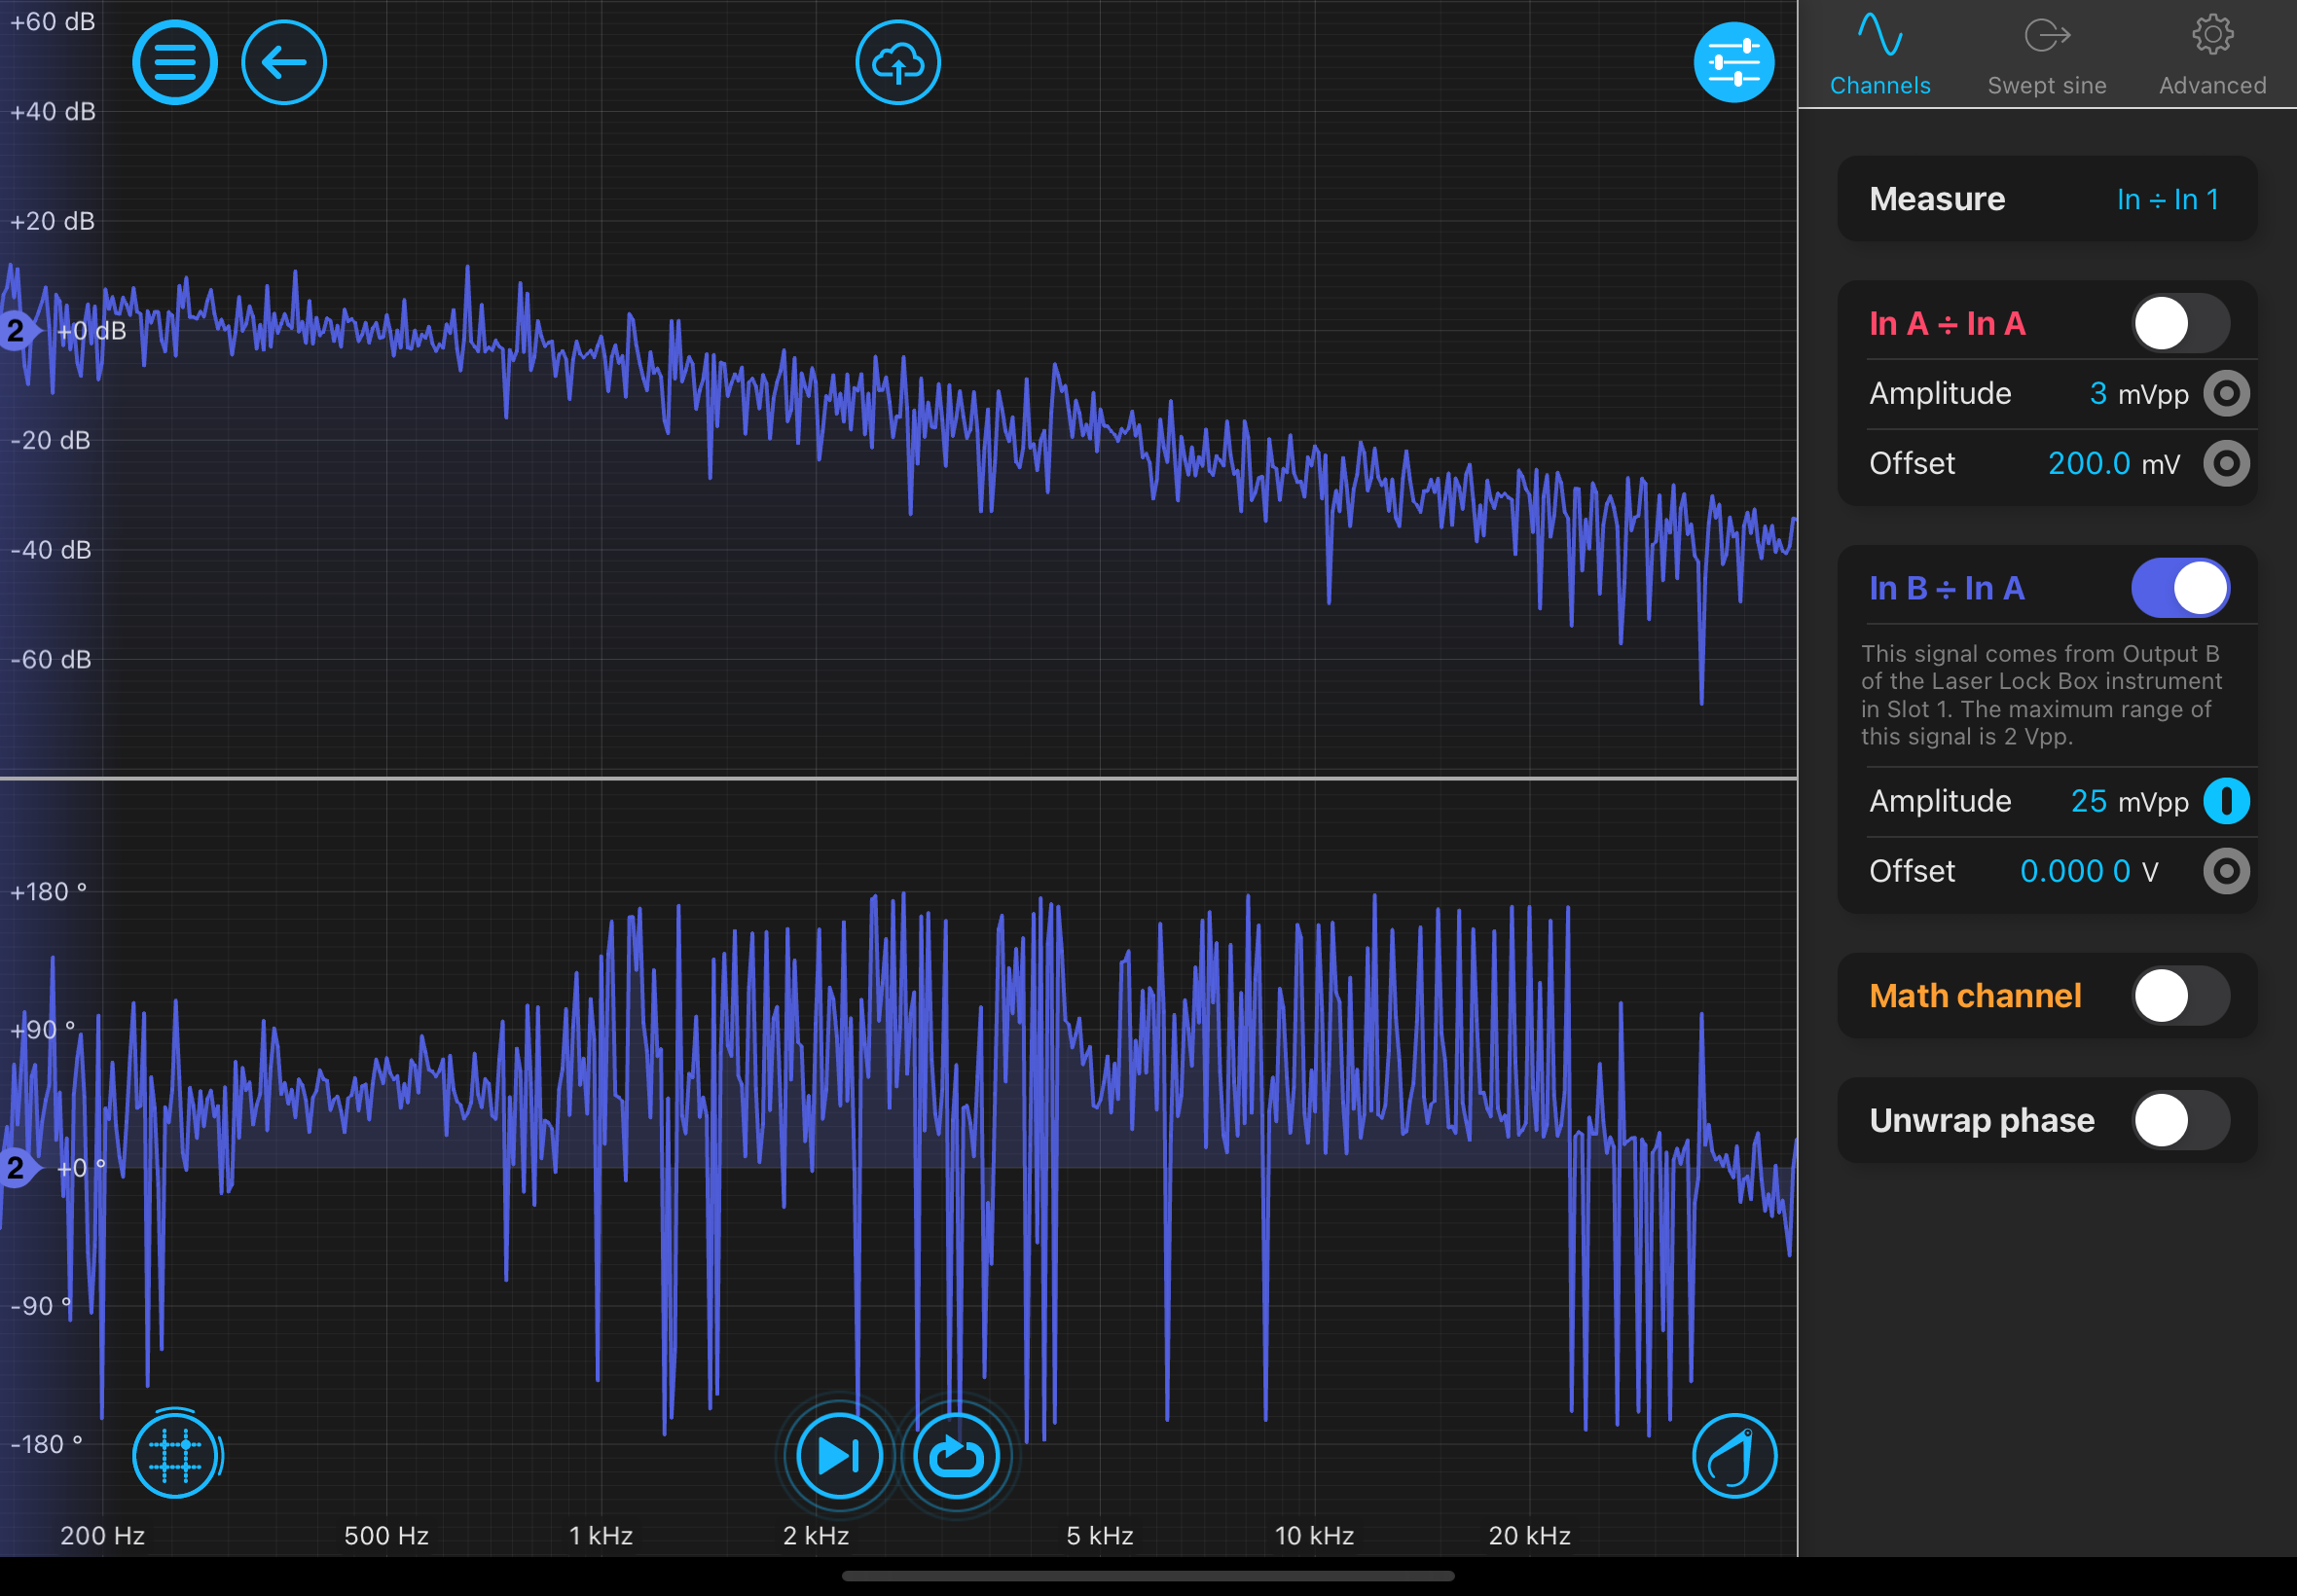
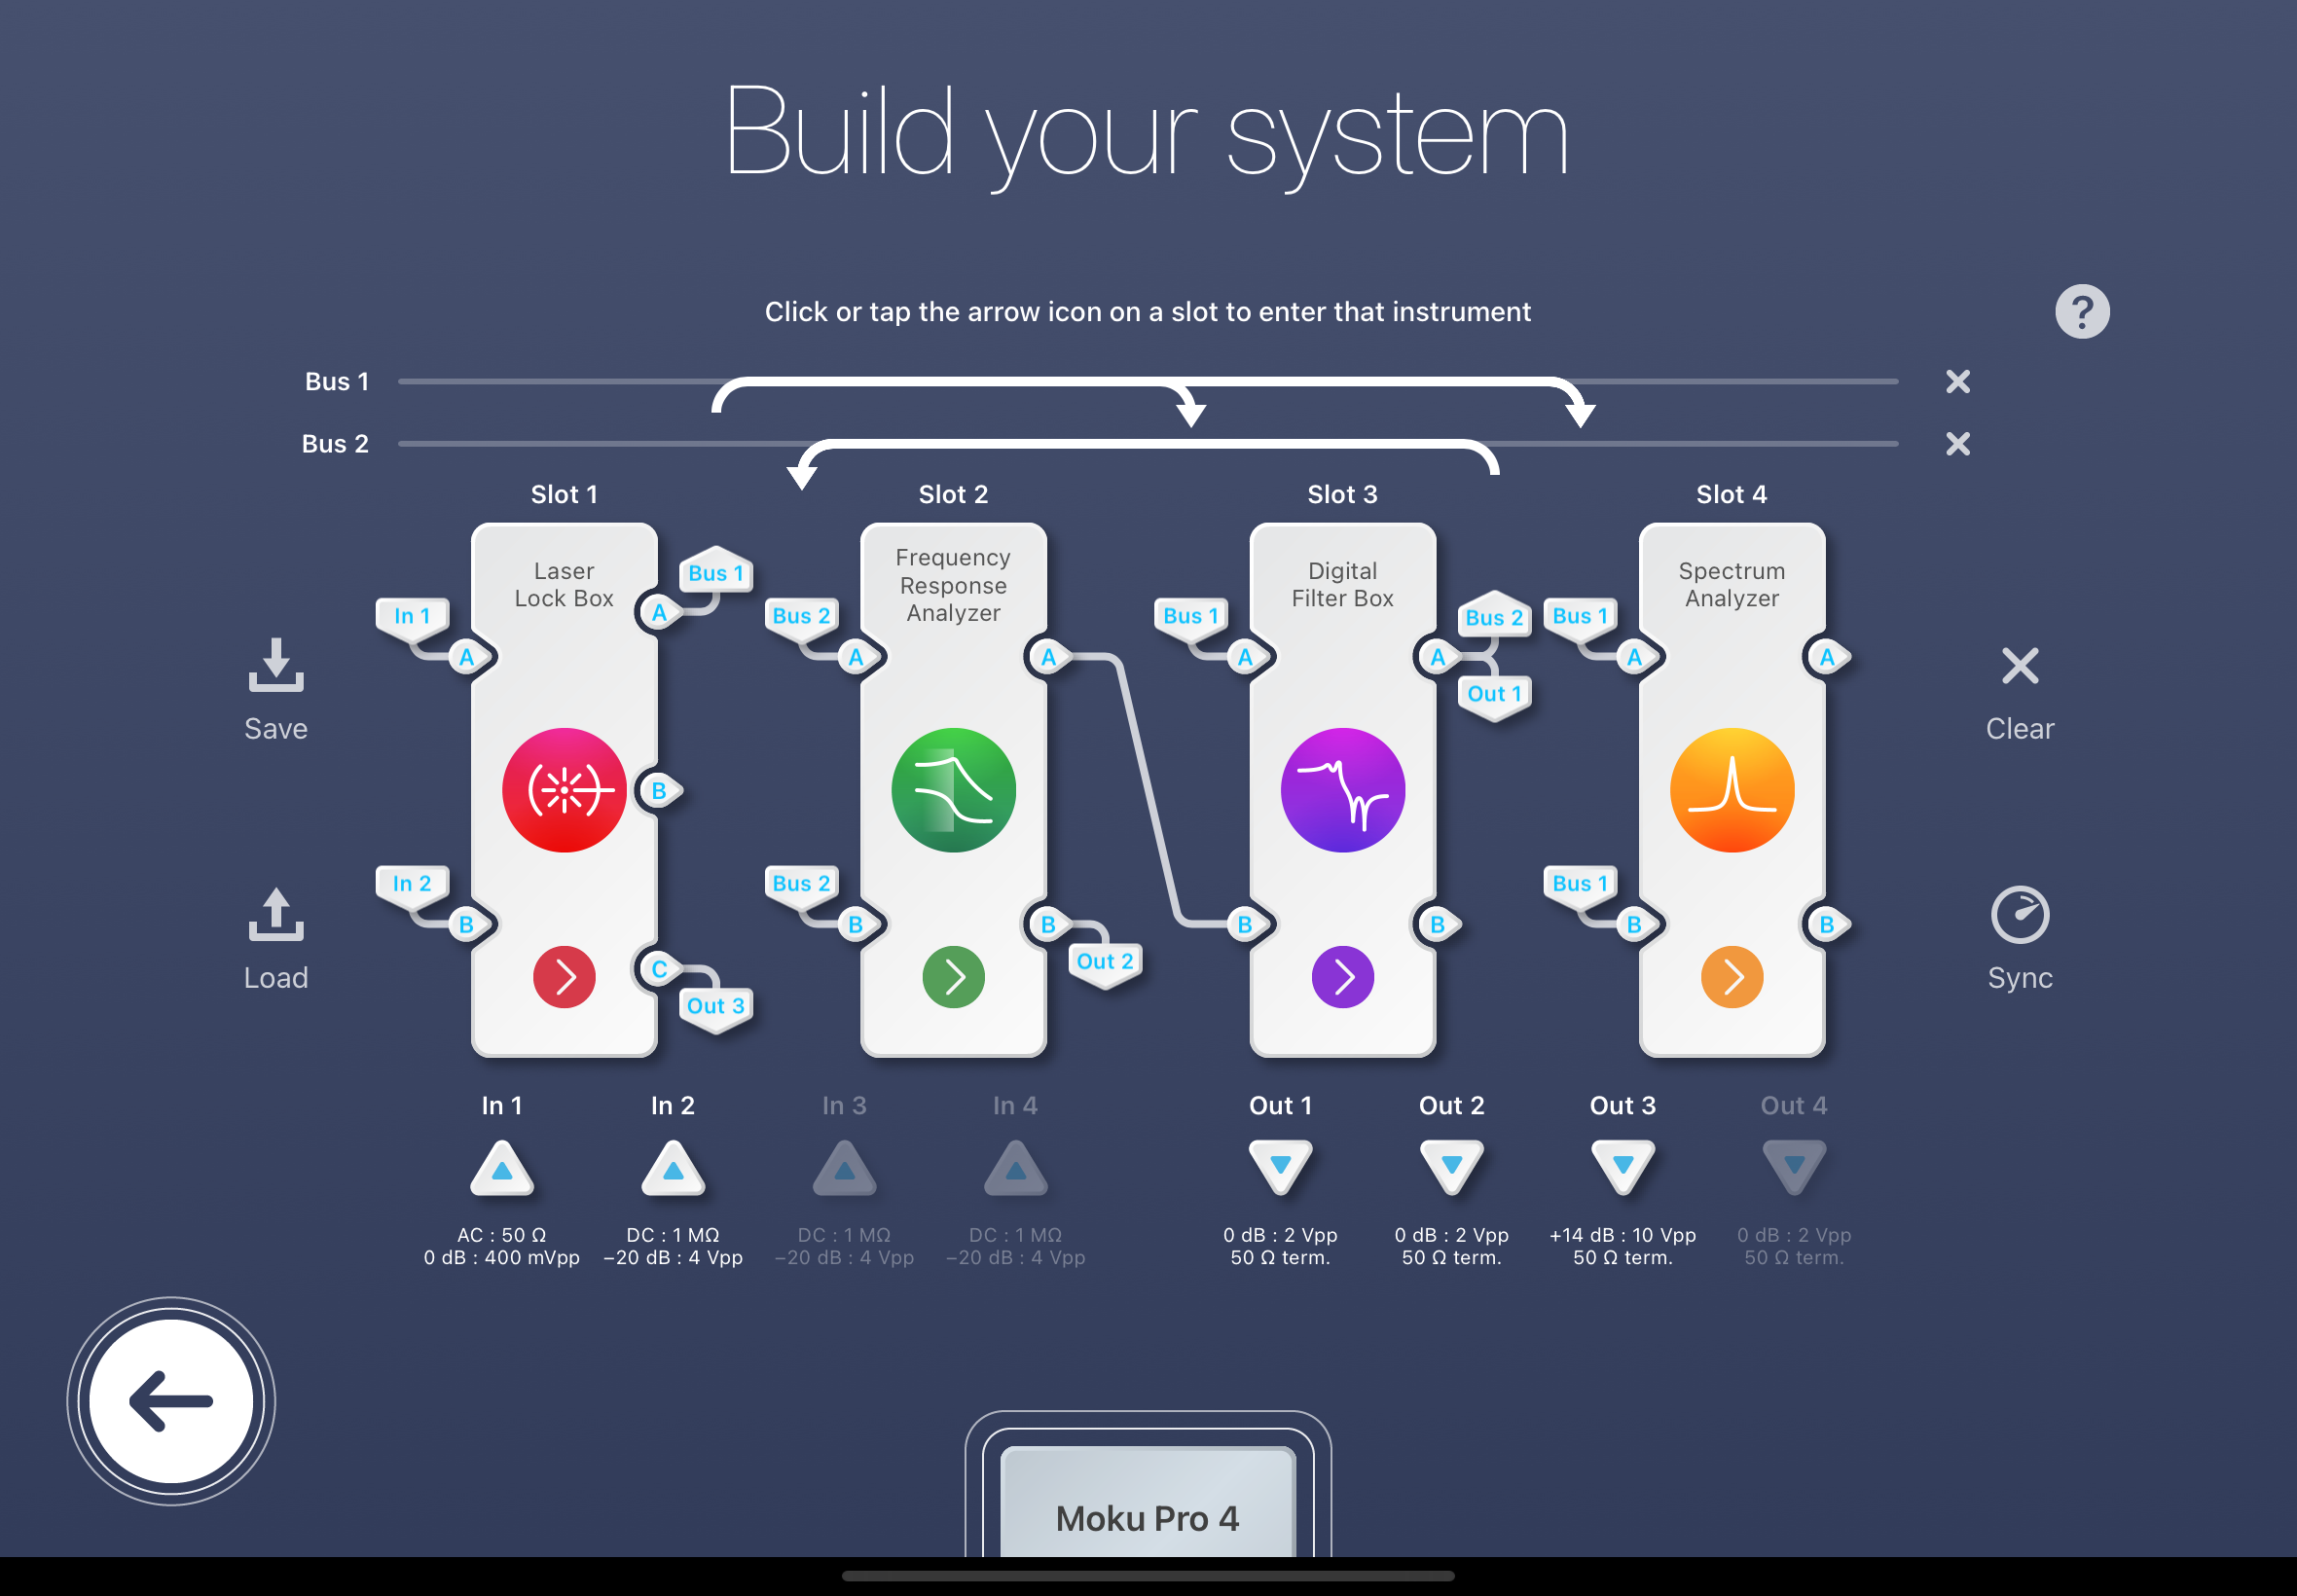
In the moku multi-instrument mode we can set up a combination of transfer functions to achieve the piezo transfer function. As seen in this, we lock the cavity with the laser. The digital filter box is used as a summer. Output 1 is used to control the DC modulation port of the ULN15TK laser and Output 2 is used for the cavity piezo. Output 3 is the 50 MHz signal used for demod. Input 1 is the newport 1811 high bandwidth PD in reflection of the cavity. Input 2 is the GE lower bandwidth PD in transmission of the cavity. Two transfer functions are set up in this configuration:

  1. Fast controller (laser frequency controller) divided by excitation to laser frequency.
  2. Fast controller (laser frequency controller) divided by excitation to the laser piezo.

We can reduce this diagram to a clearer picture of the control systems in play using a Signal Flow Graph (alternate picture to the more common block diagrams). This reduction can be seen as signal_flow.pdf. From this diagram we can see the open loop gain G can be written as \[G = H_1*F*H_2*\alpha.\] We can subsequently reduce our individual transfer functions into smaller diagrams, seen in reduction_A.pdf and reduction_B.pdf. From these it is a little easier to write down the equations for our transfer functions in terms of G and individual components. From reduction_A.pdf we see that,

\[T_p = V_{LF} \] and \[V_{VL} =  A + G V_{LF}.\] This means \[\frac{T_p}{A} = \frac{1}{1-G}.\] For now we will call this measurement one, or \[M_1 = \frac{T_p}{A} = \frac{1}{1-G}.\] Similarly from reduction_B.pdf,

\[T_p = \frac{H_p}{H_2} \frac{G}{1-G} B.\] Again lets call this measurement two, so \[M_2 = \frac{T_p}{B} = \frac{H_p}{H_2} \frac{G}{1-G}.\]

Take the ratio of M2 and M1:

\[\frac{M_2}{M_1} = G \frac{H_P}{H_2}\]. Substitute the above expression for G and solve for H2,

\[H_p = \frac{M_2}{M_1} * \frac{1}{H_1 F \alpha}\].

This is a nice form as every variable can be obtained experimentally or is known already.

  1. M1 and M2 are our measured transfered functions.
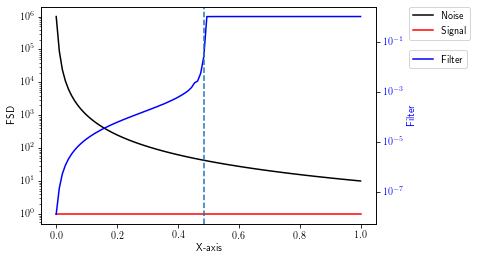
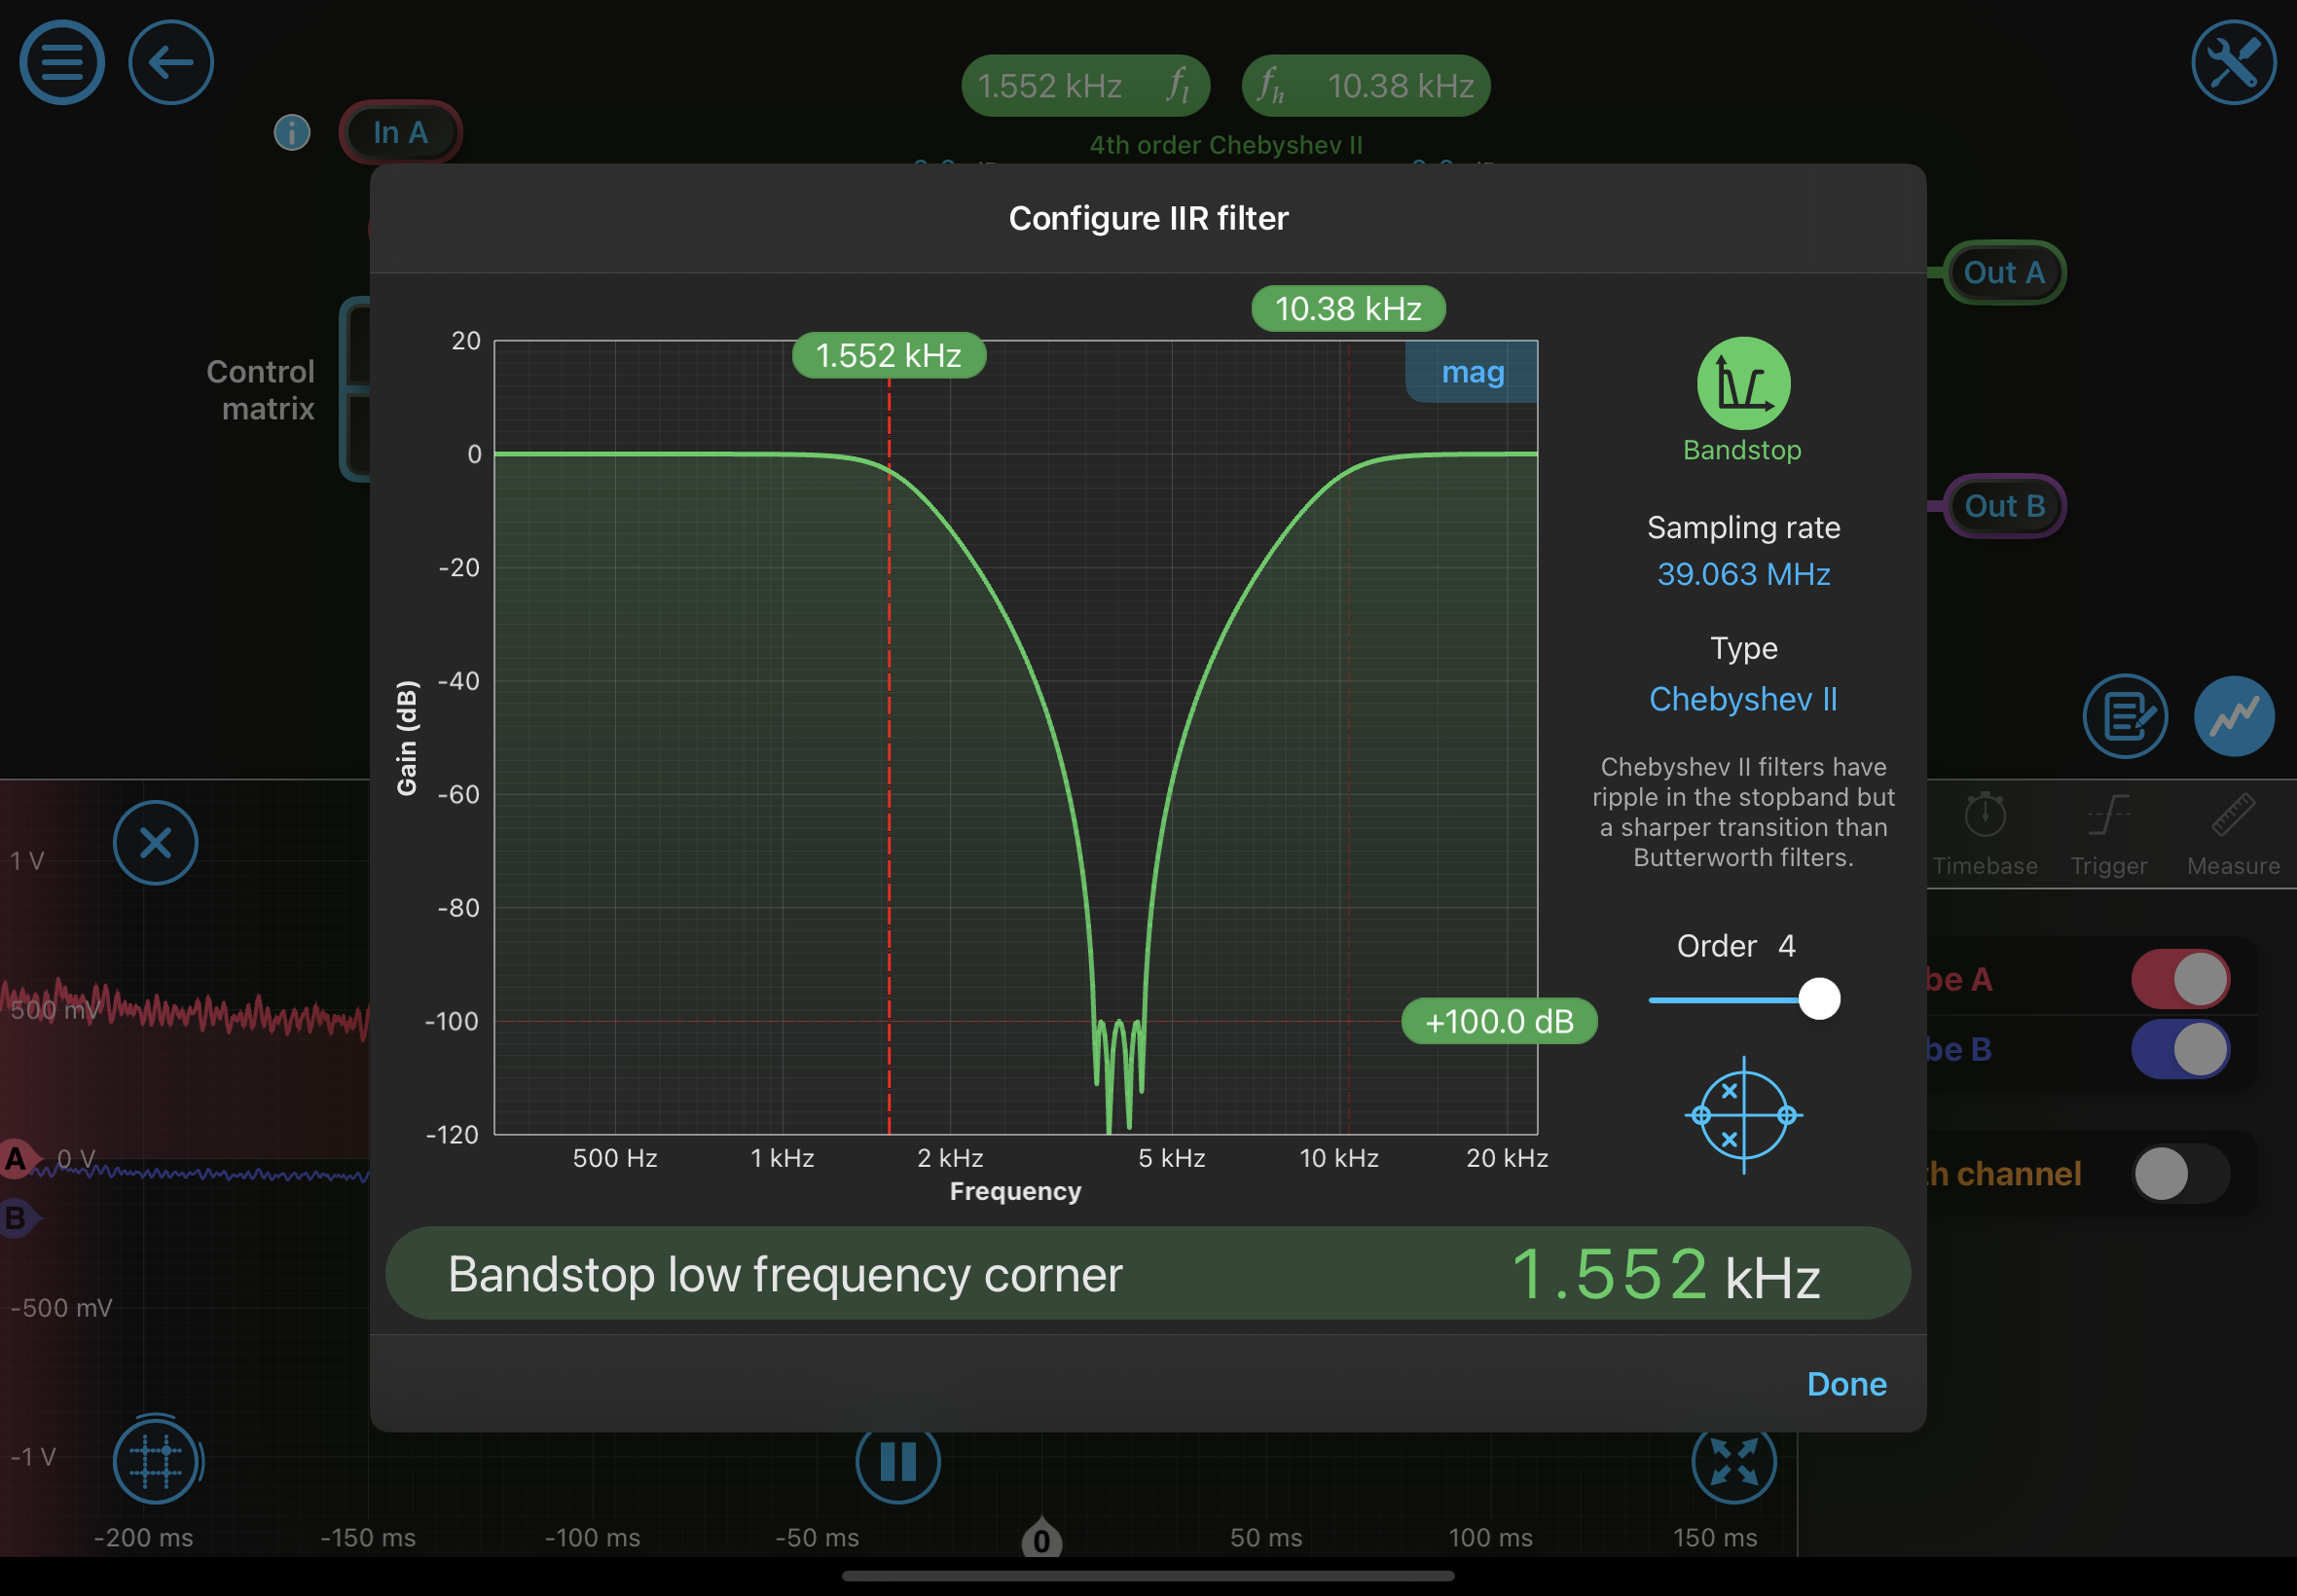
  2. F is the filter used in the digital filter box which at the time of measurement 0 db for all frequencies so trivially F=1.
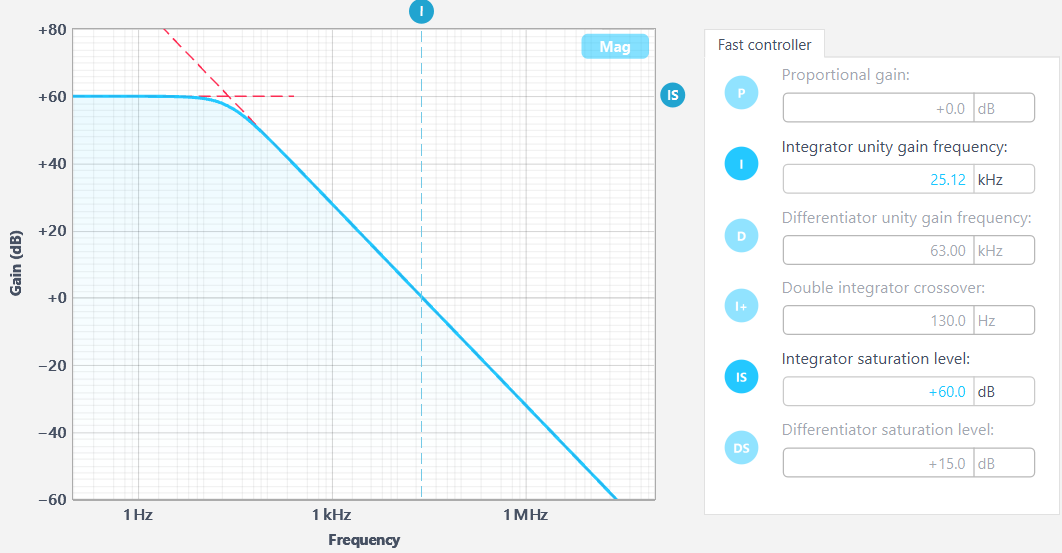
  3. H_1 is the shape of the fast controller of the laser lock box. This is slightly annoying to recreate as there is no way to download the shape of the loop directly from the fast controller of the laser lock box. I get around this by recreating it in python using scipy. Most scipy functions seem to want the order of the filter and cutoff frequency; cutoff frequency being a problem as the controller shape is defined by the UGF and not cutoff frequency (ex: fast_controller_example.png). A conversion can be made but slightly annoying. Jeff is currently very close to being done with a script that will take these 6 inputs and recreate the shape of the controller in python.
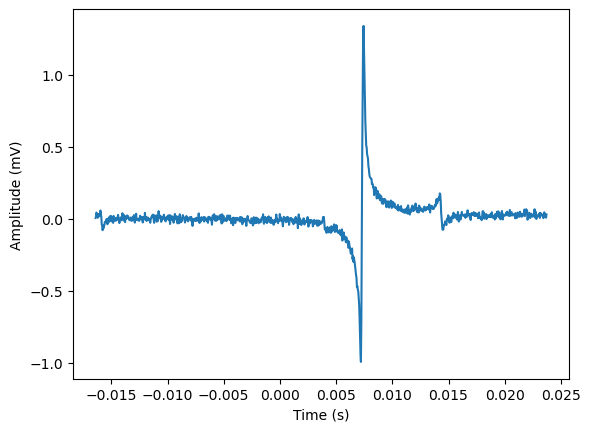
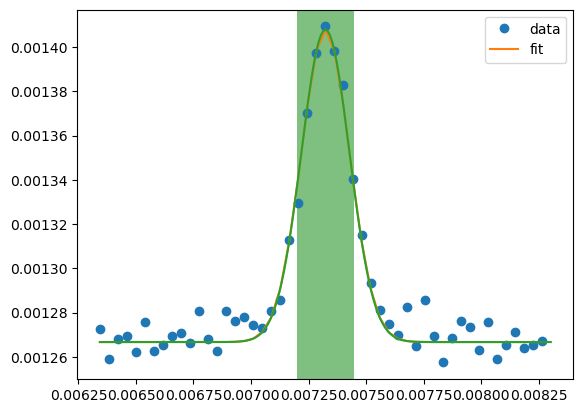
  4. Alpha is the conversion from Hz into Volts from the laser frequency to the PDH lock. This is found by the ratio of the amplitude of the error signal in the PDH lock and the cavity bandwidth. The error_signal amplitude can be found trivially by putting one of the moku test points at the error signal. The cavity bandwidth can be derived or measured in a few different ways. The method we went with was to scan the laser frequency to see 0,0 peaks in the TRANS PD. This peak will have some width, from which the FWHM in time (delta t). In order to convert this to a frequency we do the following conversion:

\[\mathrm{BW(Hz)}  = \Delta t * \frac{2 A}{T} * \frac{2 mA}{V} \frac{5 pm}{20 mA} \frac{c}{\lambda^2}\]

From the data collected this yields approximately 307 kHz bandwidth for the cavity with the low reflectivity mirrors (R ~~ 99%).

Results

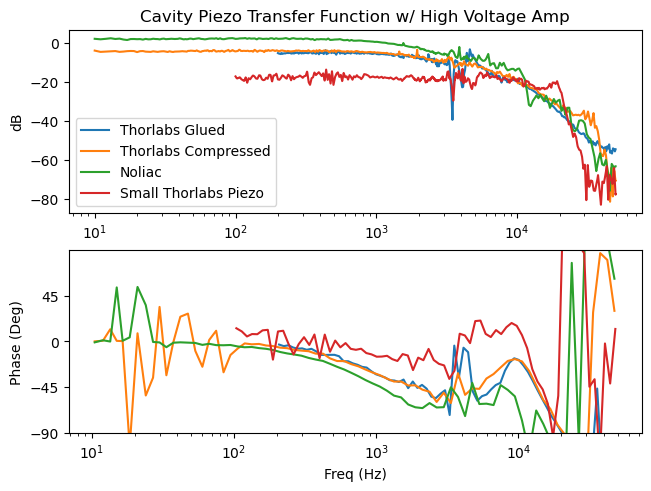
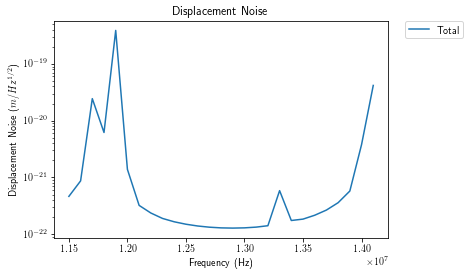
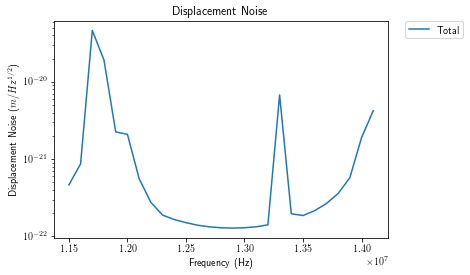
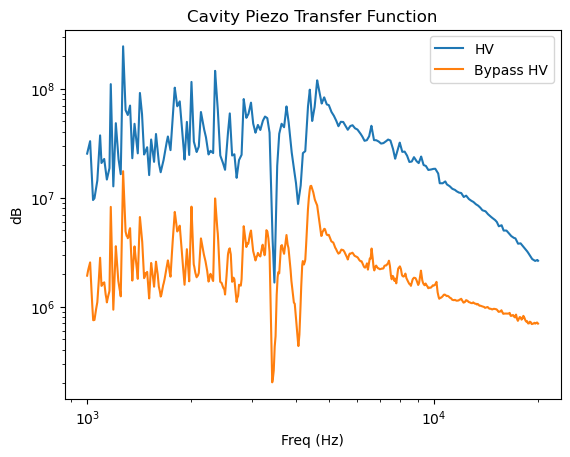
The final result of \[H_p = \frac{M_2}{M_1} * \frac{1}{H_1 F \alpha}\] yields result.png. I think there is a scaling factor off somewhere but the shape makes sense. Also something to look into is the low quality of the data at low frequencies, of which Lee has given me ideas on how to correct this. We cannot simply drive these things harder.

Images attached to this report
Non-image files attached to this report
Comments related to this report
Torrey Cullen - 11:26, Tuesday 27 February 2024 (11487)

[Ian, Torrey]

Update to the above. 

As seen from the final result above, the low frequency data is garbage. Eventually we will want to be able to shape a loop at all frequencies. To get around this we have approximated the low frequencies as just the shape of the fast controller. We then wrote some code to stitch them together in a given frequency range, where below this range M1 is given as just the fast controller, in this window it is given as a combination of the two, and above it it is given as just the measured data. This window is represented by the shaded green in result_updated.png. I will post this script to the log in a follow up post once I have cleaned it up.

We should be able to quickly model the cavity piezo transfer function at all frequencies based on a few inputs now. 

Images attached to this comment
Torrey Cullen - 11:23, Wednesday 28 February 2024 (11492)

[Ian, Alex, Torrey]

The previous data taken was with the thorlabs piezo that is glued to the mirror. We swapped out M3 with the noliac piezo and thorlabs piezo in the compressed configuration, realigned both times, and took the same data and ran it through my code. The result of which can be seen in the above plots. I plan on doing these same measurements with a square noliac piezo and the small thorlabs piezo in compressed configuration.

Images attached to this comment
Controls General
Jeffrey Wack - posted 11:11, Tuesday 20 February 2024 (11480)
Moku API limitations

1) The LaserLockBox instrument is currently not fully configurable in Multi-Instument mode, the API does not allow you to configure the modulation output.  LaserLockBox in MultiInstrument

2) If you set filters with the API and then connect to the Moku via iPad, it resets the filters to default. Switching from API to GUI

Lasers Laser Filter Cavity (GQuEST)
Daniel Grass - posted 15:30, Monday 19 February 2024 (11479)
Failed Residue Removal from the End Cubes; Covered Residue with Kapton Tape

I tried to remove the residue on the end cubes that was left over from the tape. I used isopropanol last week and acetone this week, but neither worked. I therefore covered the residue in Kapton so that the residue does not contaminate the lab space. See attached photo.

Images attached to this report
Lasers Laser Filter Cavity (GQuEST)
Daniel Grass - posted 15:05, Monday 19 February 2024 (11478)
10

I removed the 2" long, 5/16-24 set screws from the 10" to 8" Flange Size Zero Length Reducer. The set screws do not have a hex drive (perhaps they are more accurately called studs), and ~16 of the 20 required pliers to remove. This caused a bit of silver plating to come off, but it was easily removed with an air duster. The ends of the screws furthest away from the flange were quite dirty and/or lost their silver coating. See attached photo.

I then used isopropanol and Kim wipes to clean the non vacuum part of the reducer. Some gunk made it into the part where the copper gasket lies outside the knife edge. I cleaned this to the best of my abilities. See attached photo.

Images attached to this report
GQuEST General
Daniel Grass - posted 17:25, Tuesday 03 October 2023 - last comment - 00:43, Monday 19 February 2024(11311)
3D Printed a Cover for the ULN15TK Seeder Laser

Torrey and Daniel October 3, 2023

Daniel 3D printed a cover for the ULN15TK Seeder Laser that makes it very difficult to accidentally turn on or off the seeder. Torrey printed and attached warning labels conveying that one should not turn the seeder off so that the amplifier isn't damaged. If we are really paranoid, Daniel could 3D print a cover with a tighter fit.

Comments related to this report
Daniel Grass - 00:43, Monday 19 February 2024 (11477)

Attached are the SolidWorks and STL files for the 3D printed part. I did not recreate the seeder as a SolidWorks file. If I were to 3D print this part again, I would change the design so the cover were a little more snug on the seeder.

Non-image files attached to this comment
Displaying reports 801-820 of 1093.Go to page Start 37 38 39 40 41 42 43 44 45 End