Daniel Grass - posted 17:02, Friday 09 February 2024 (11343)
Chip in One of the Power Distribution BS Cubes
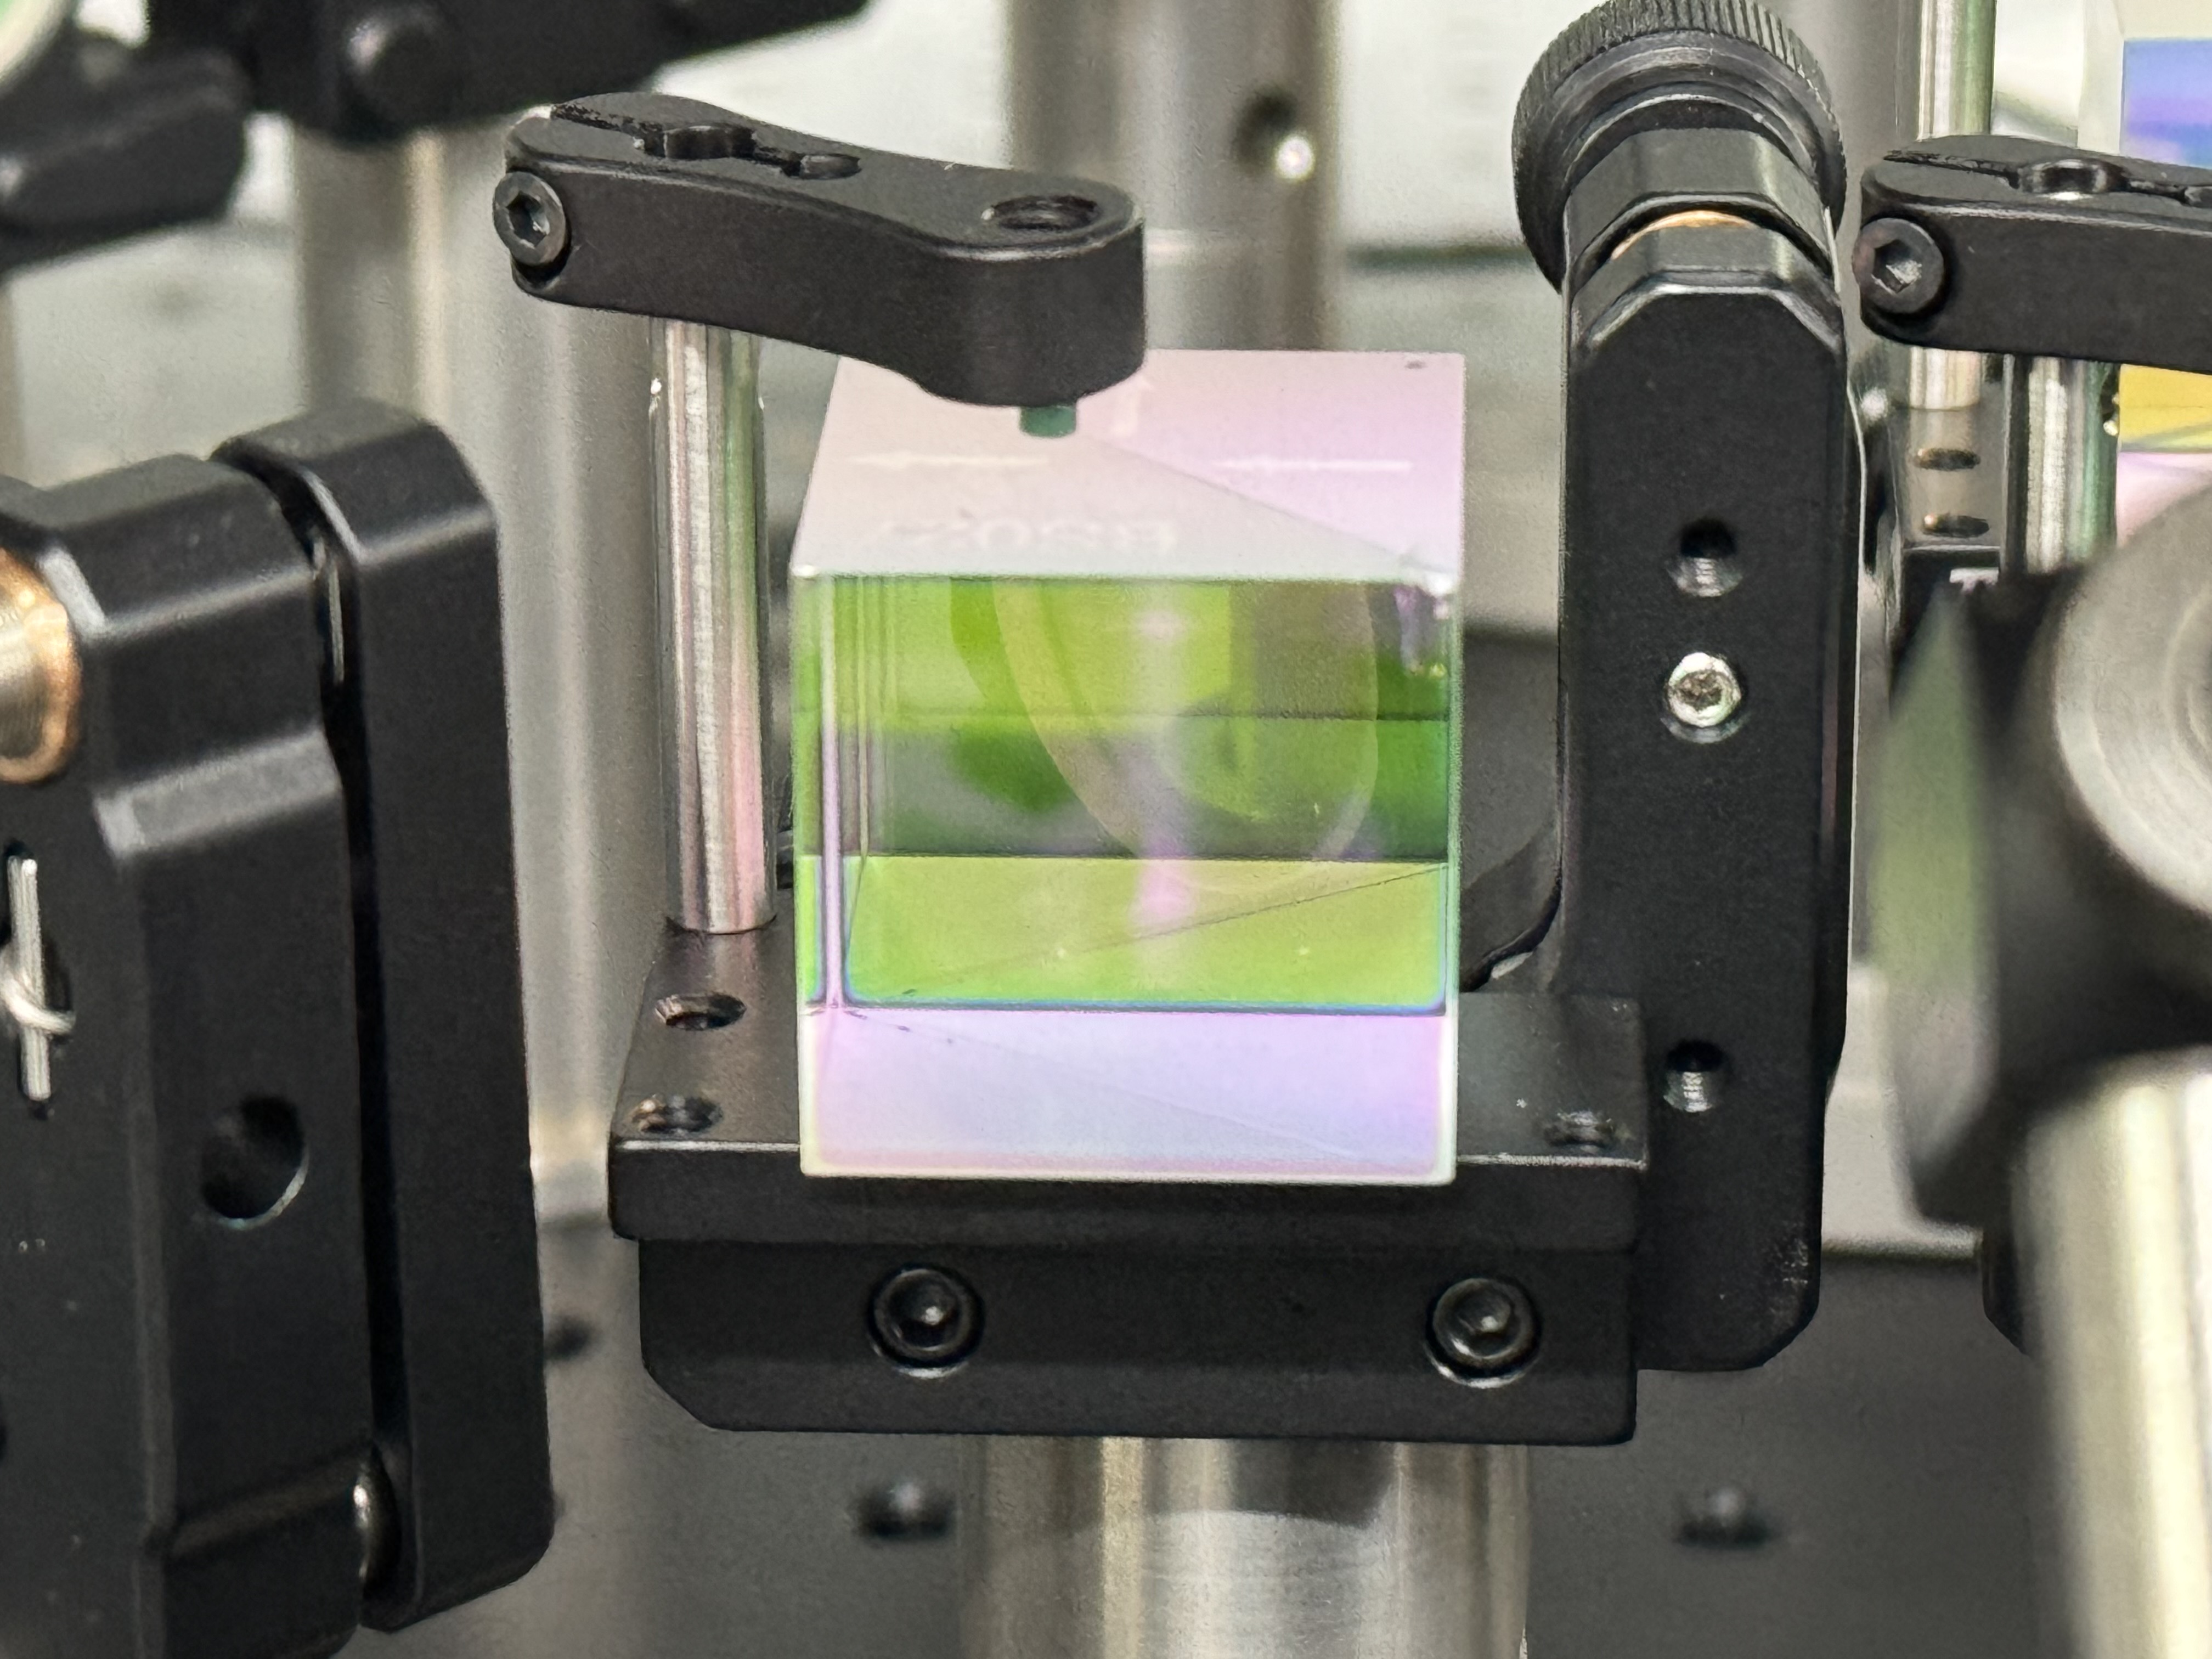
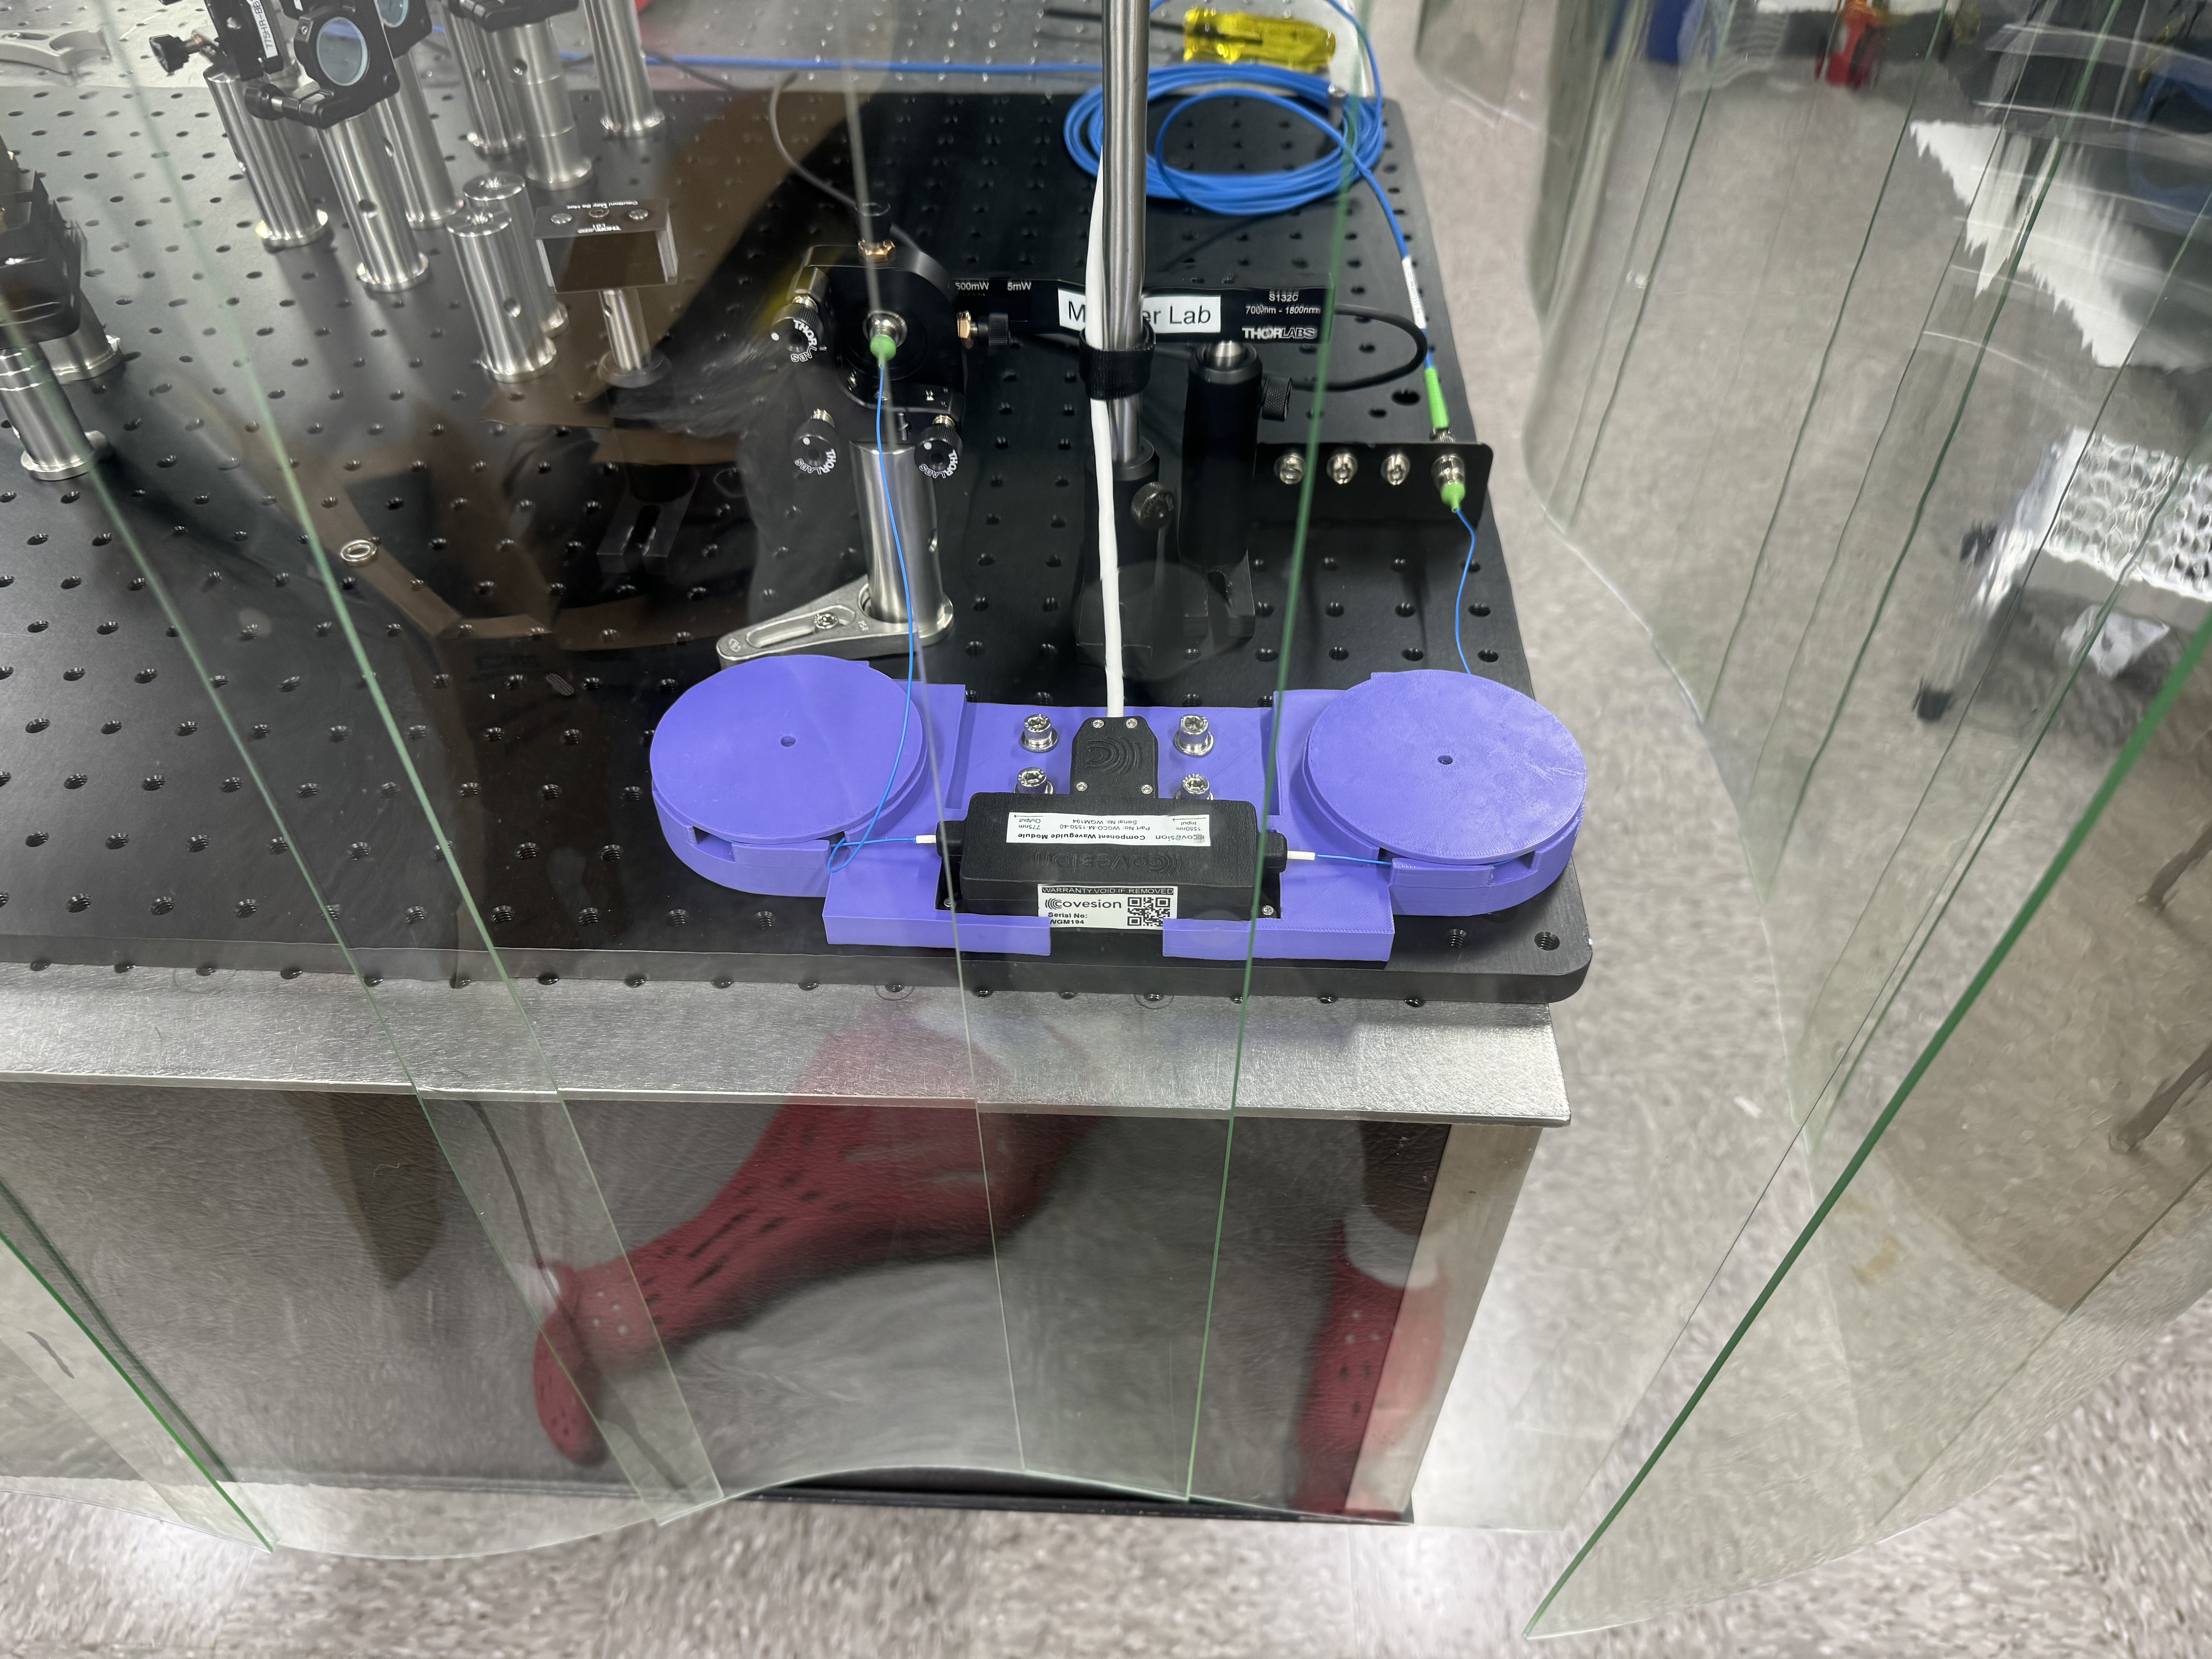
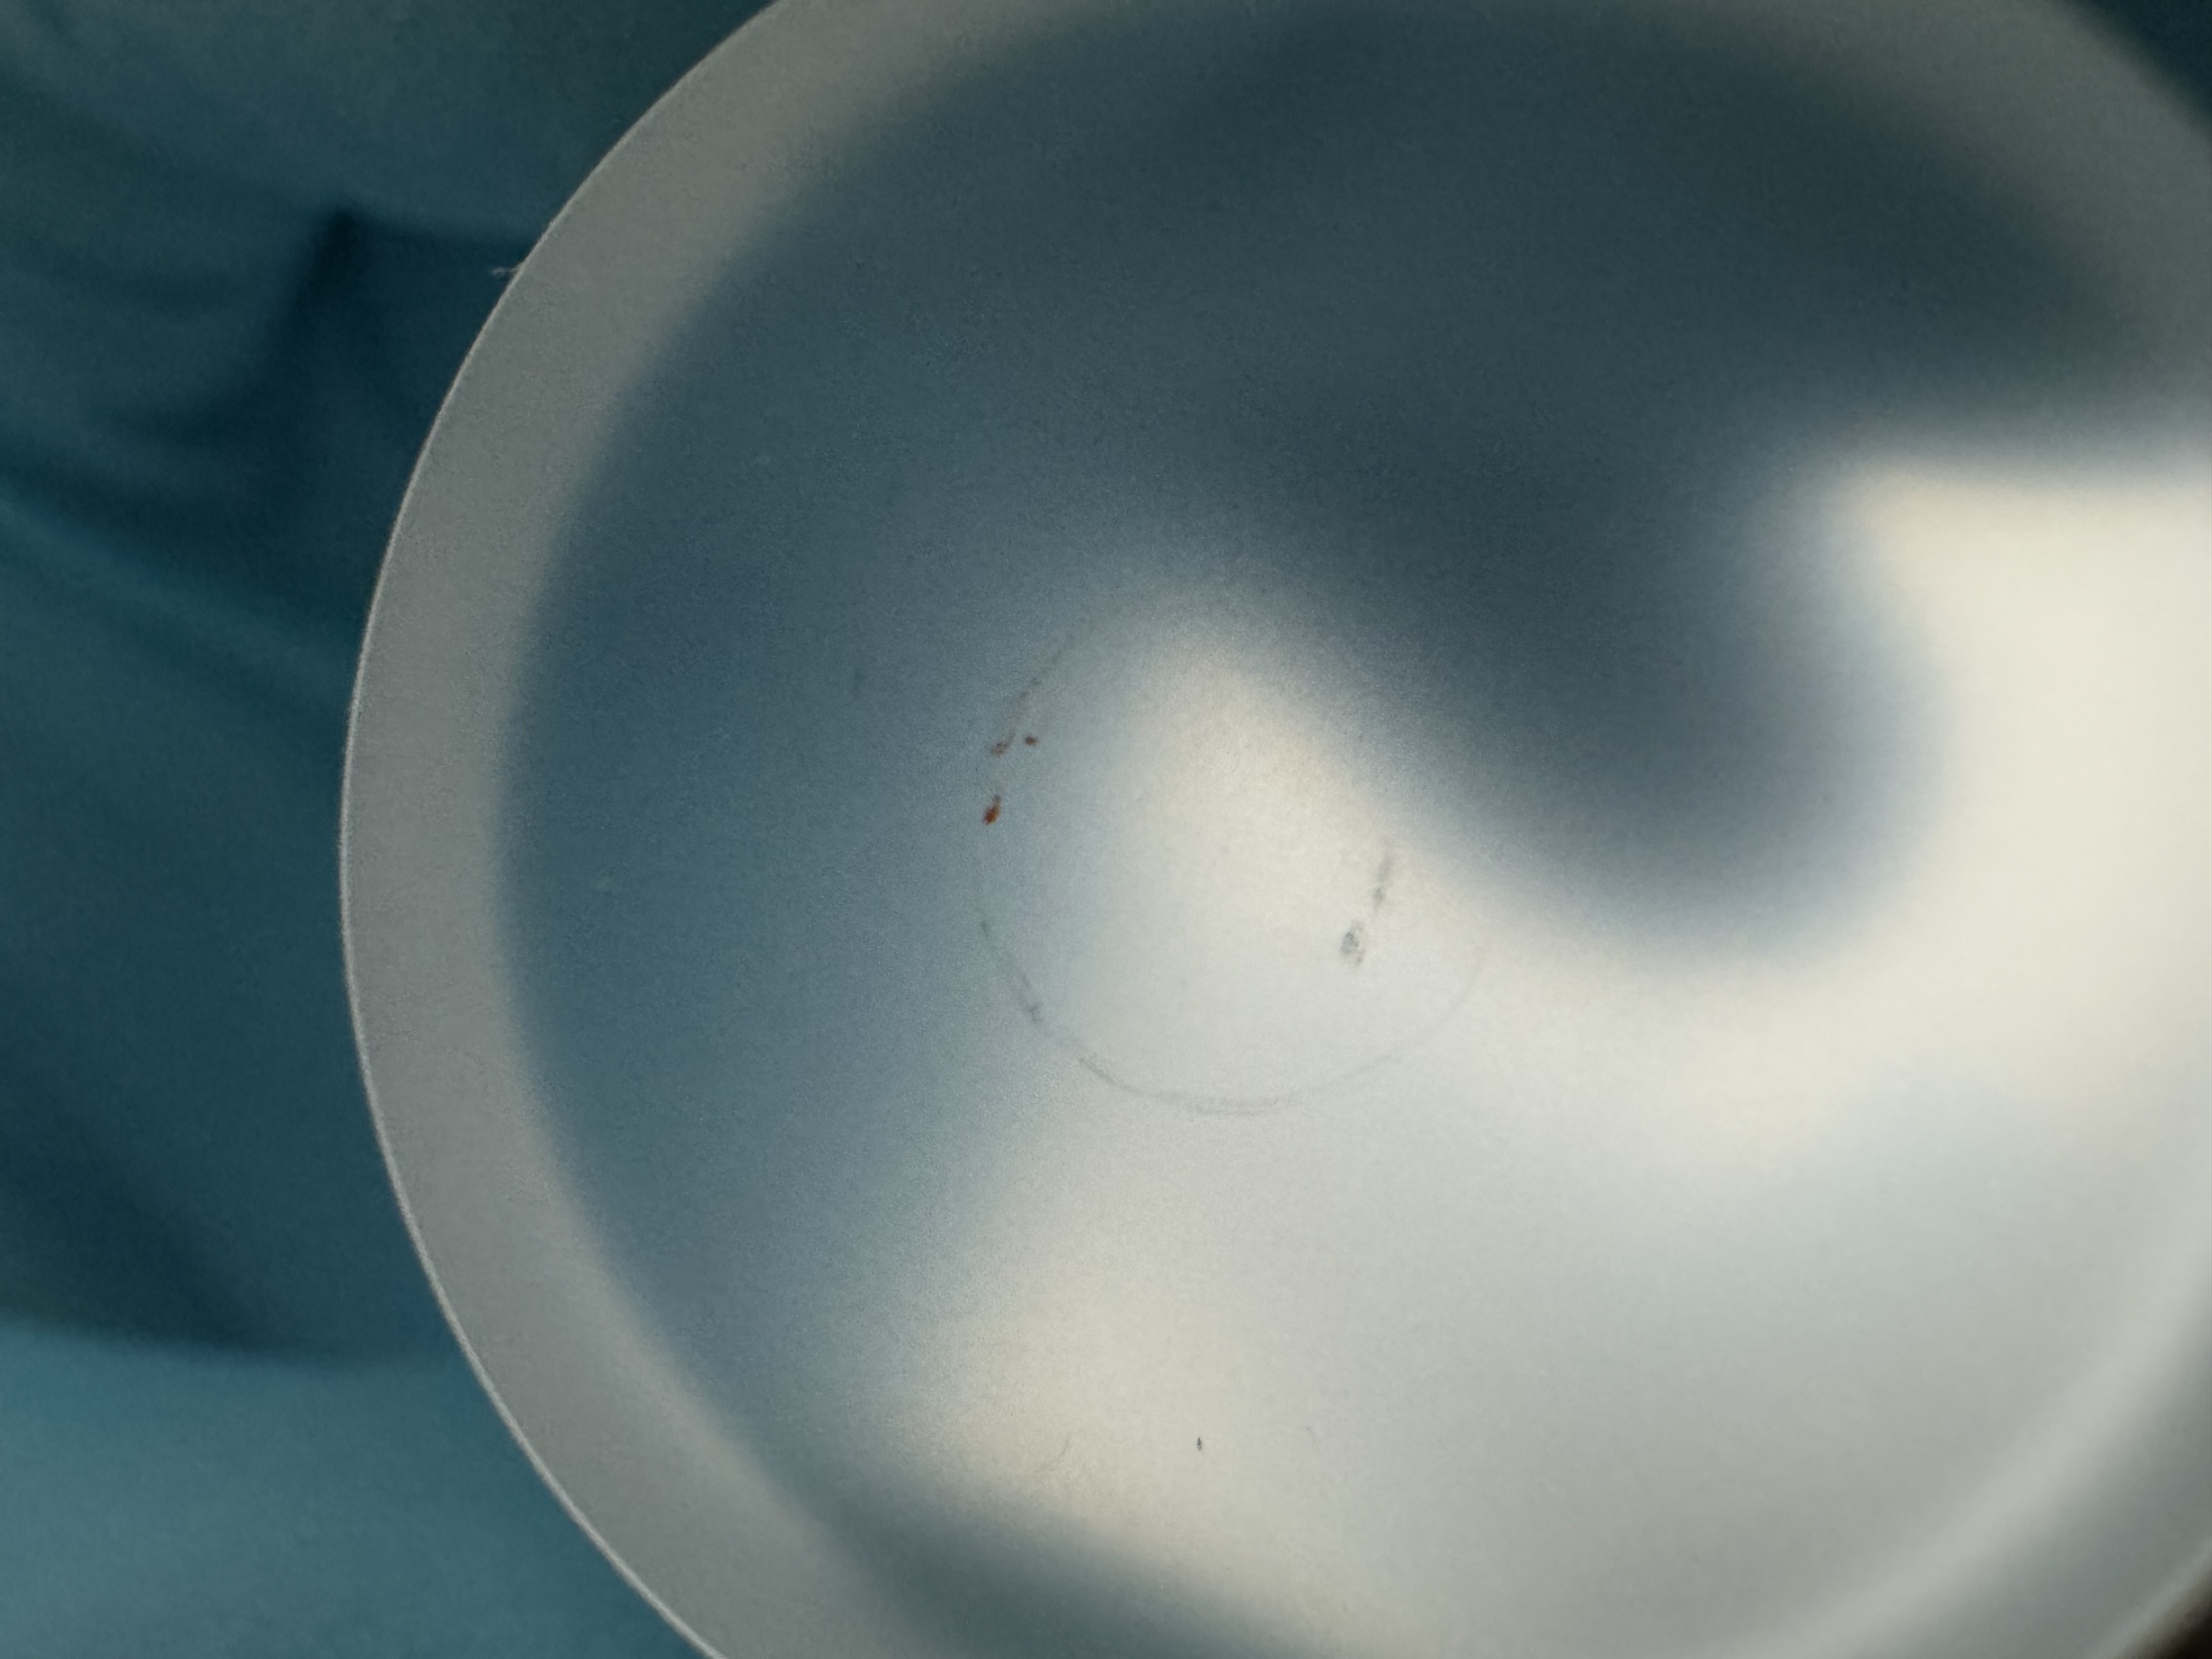
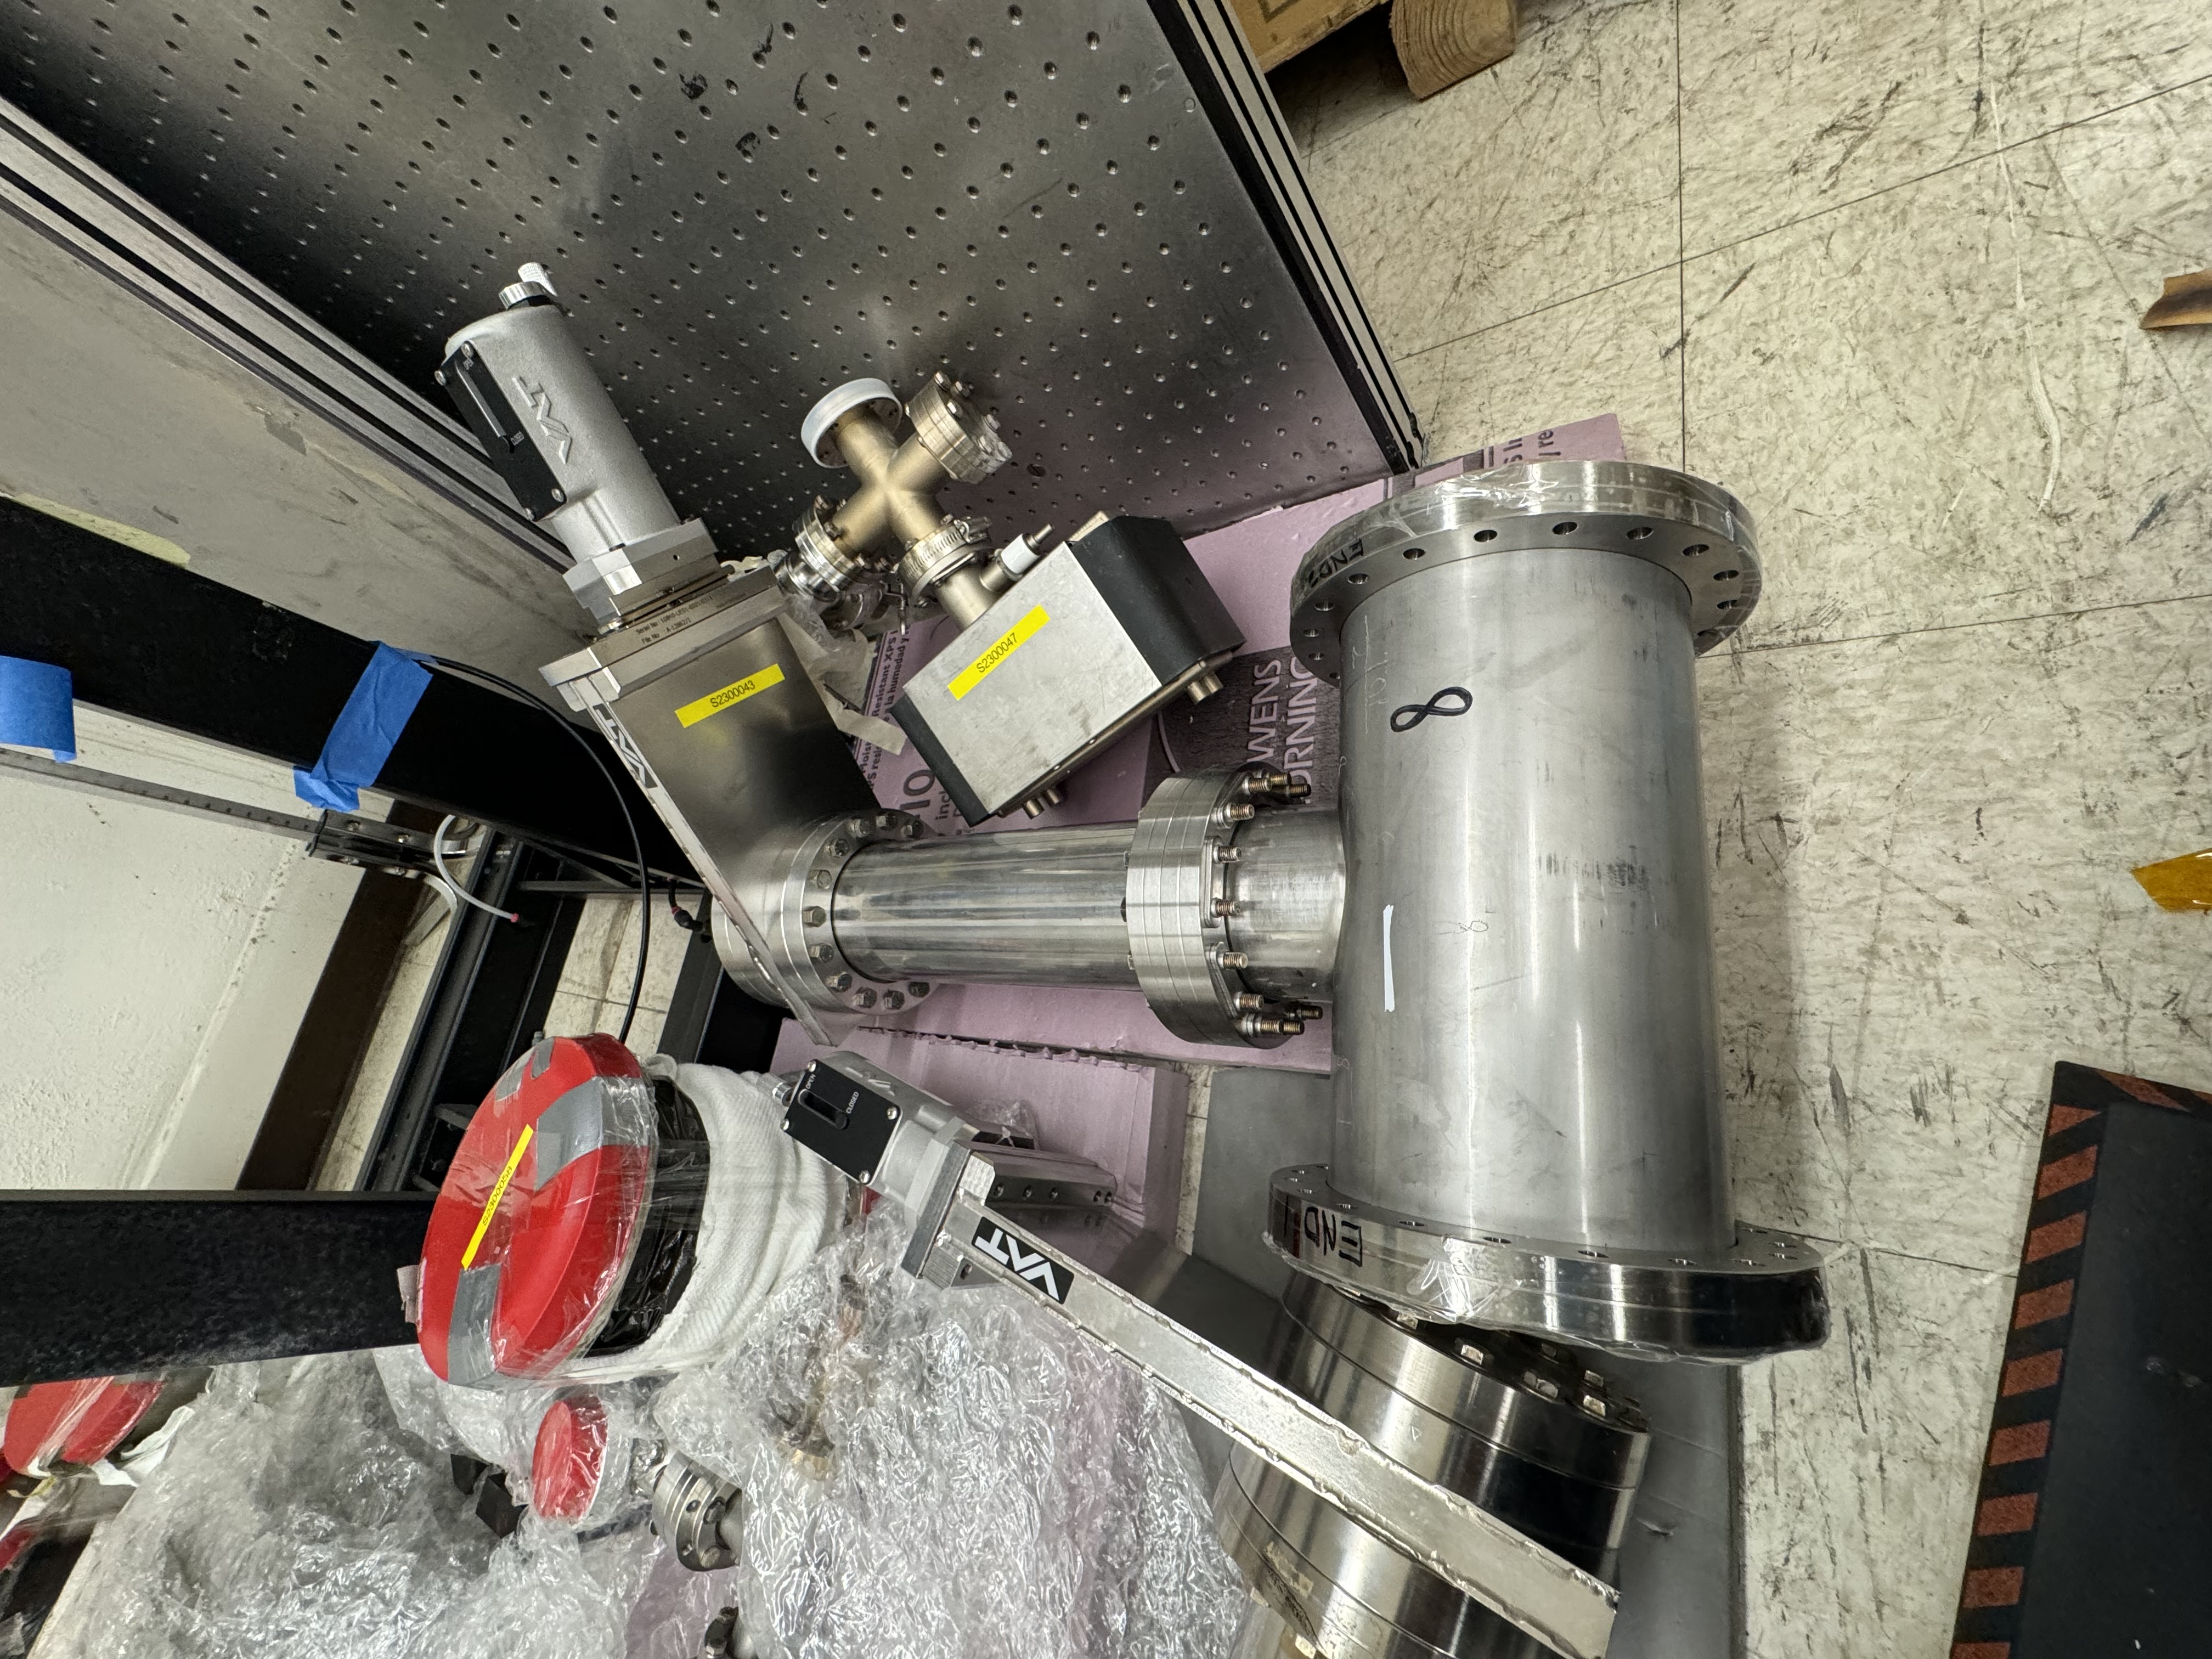
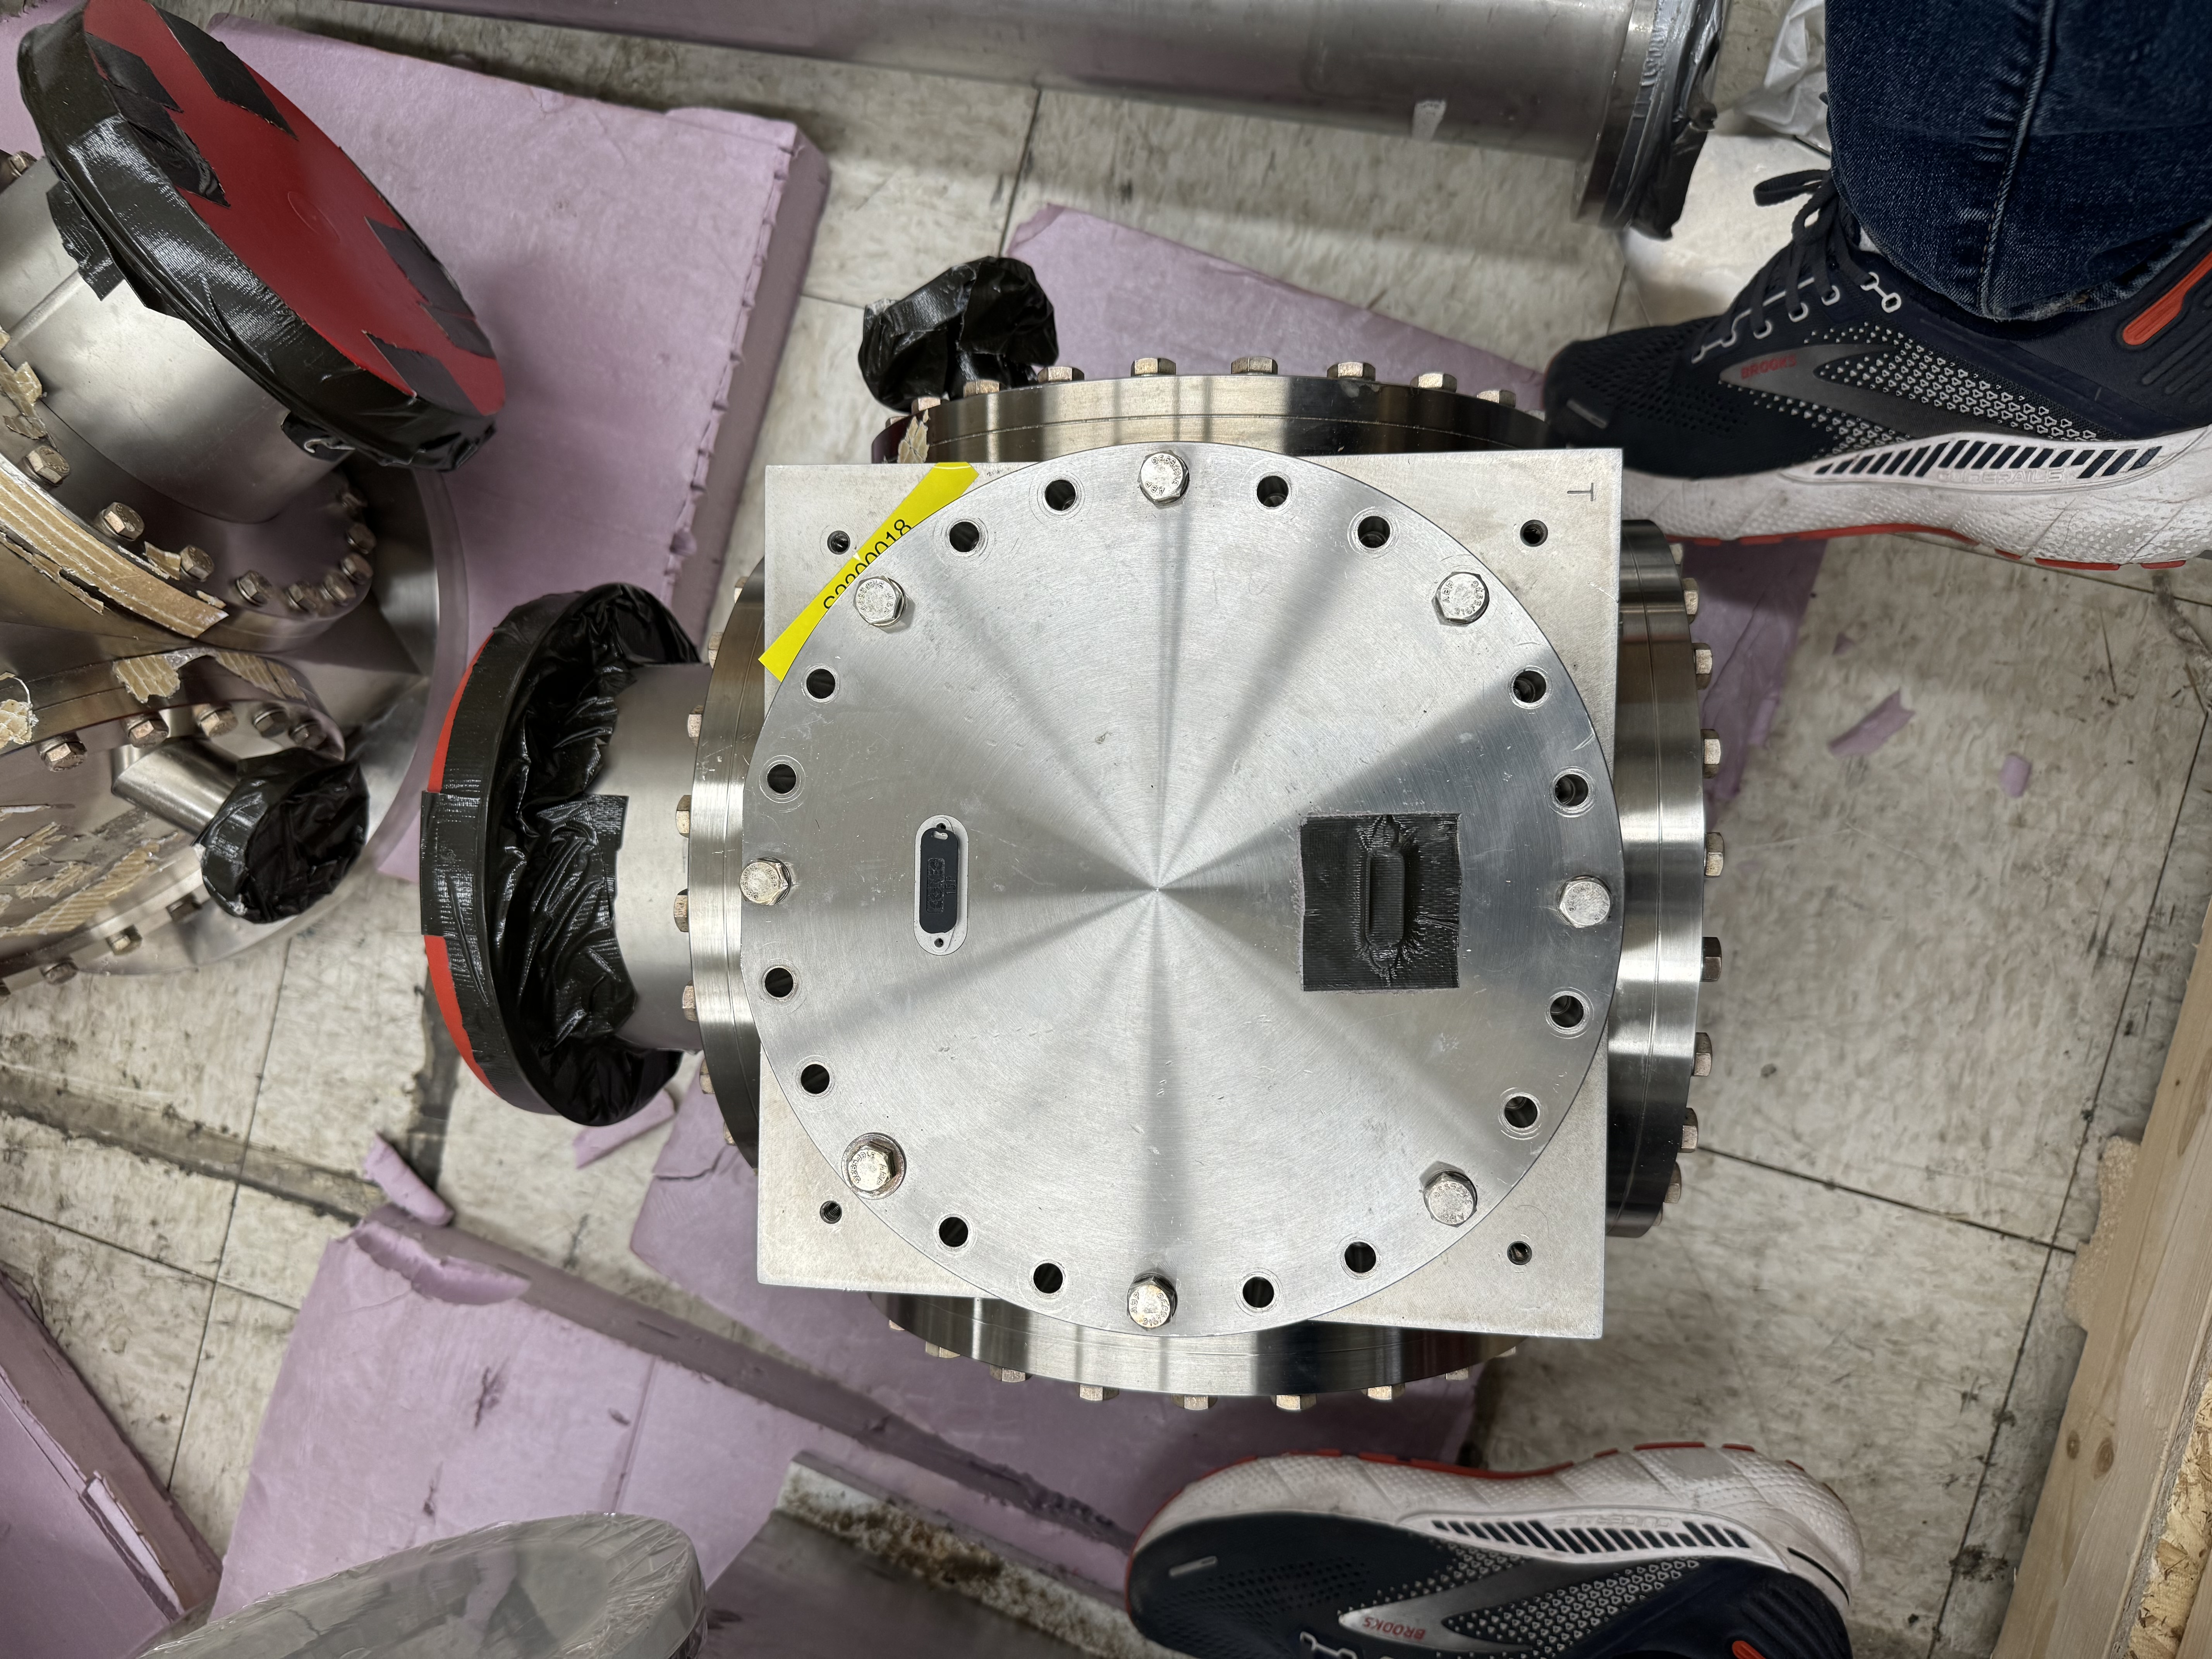
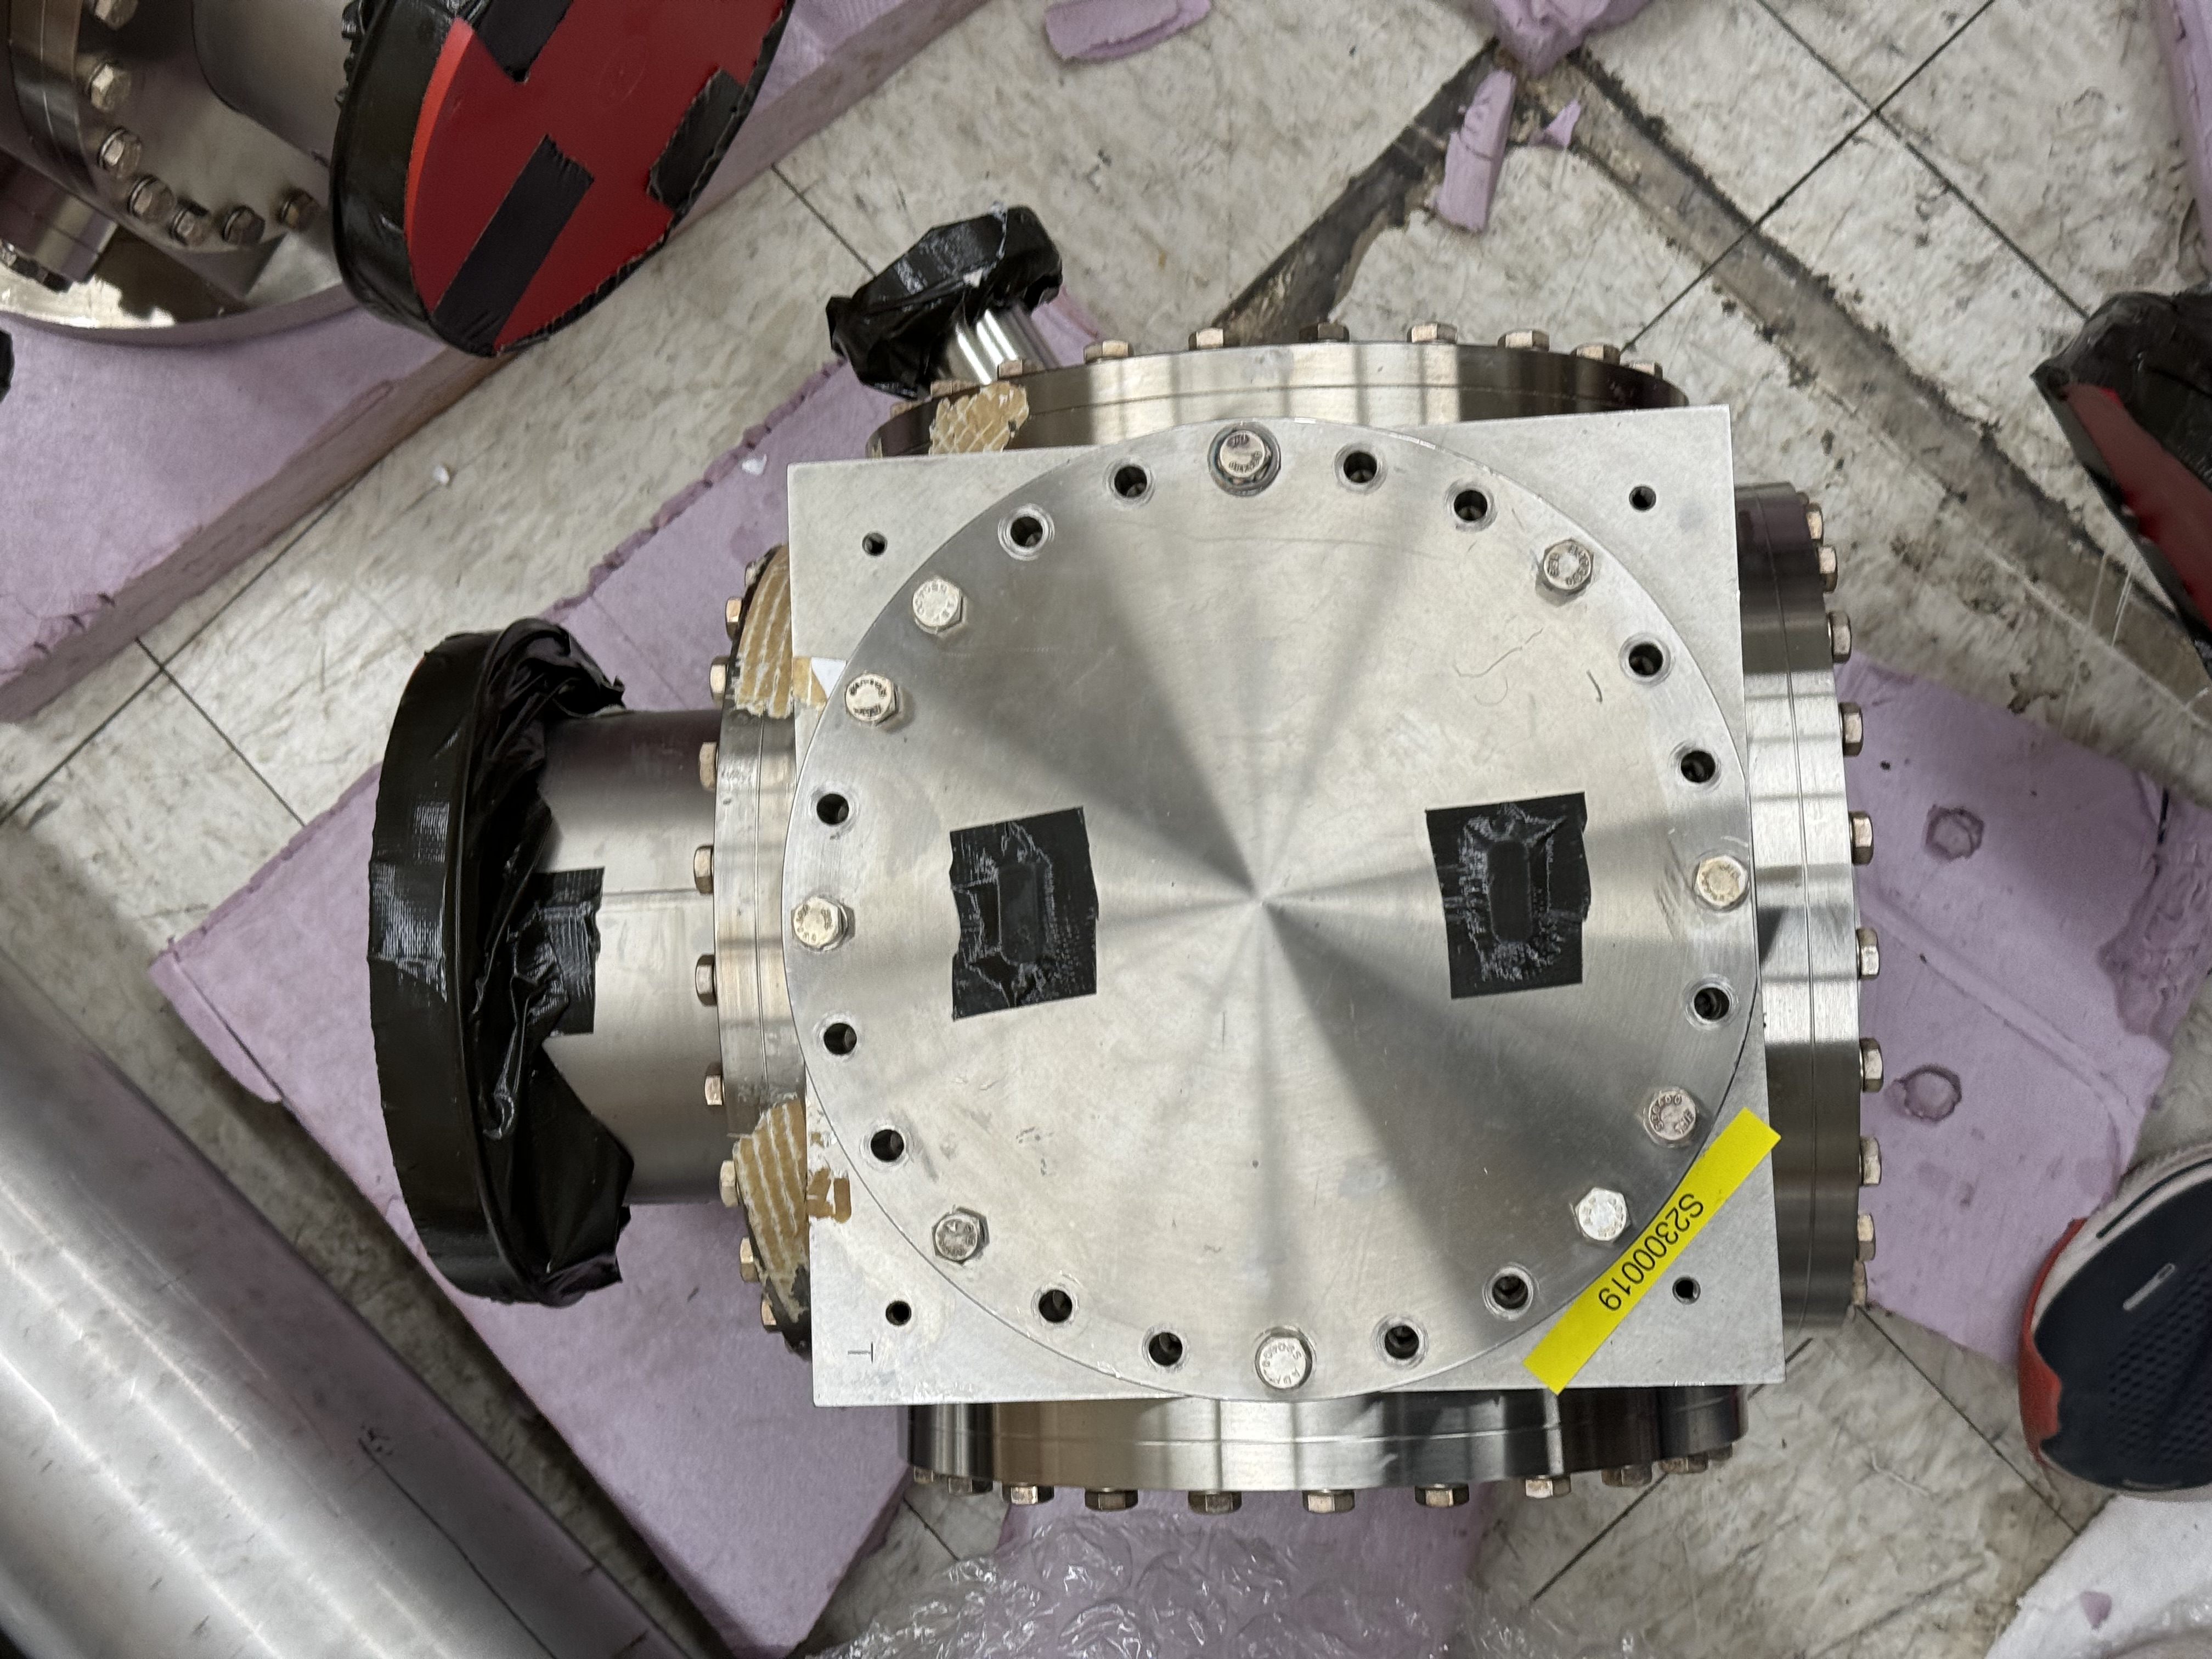
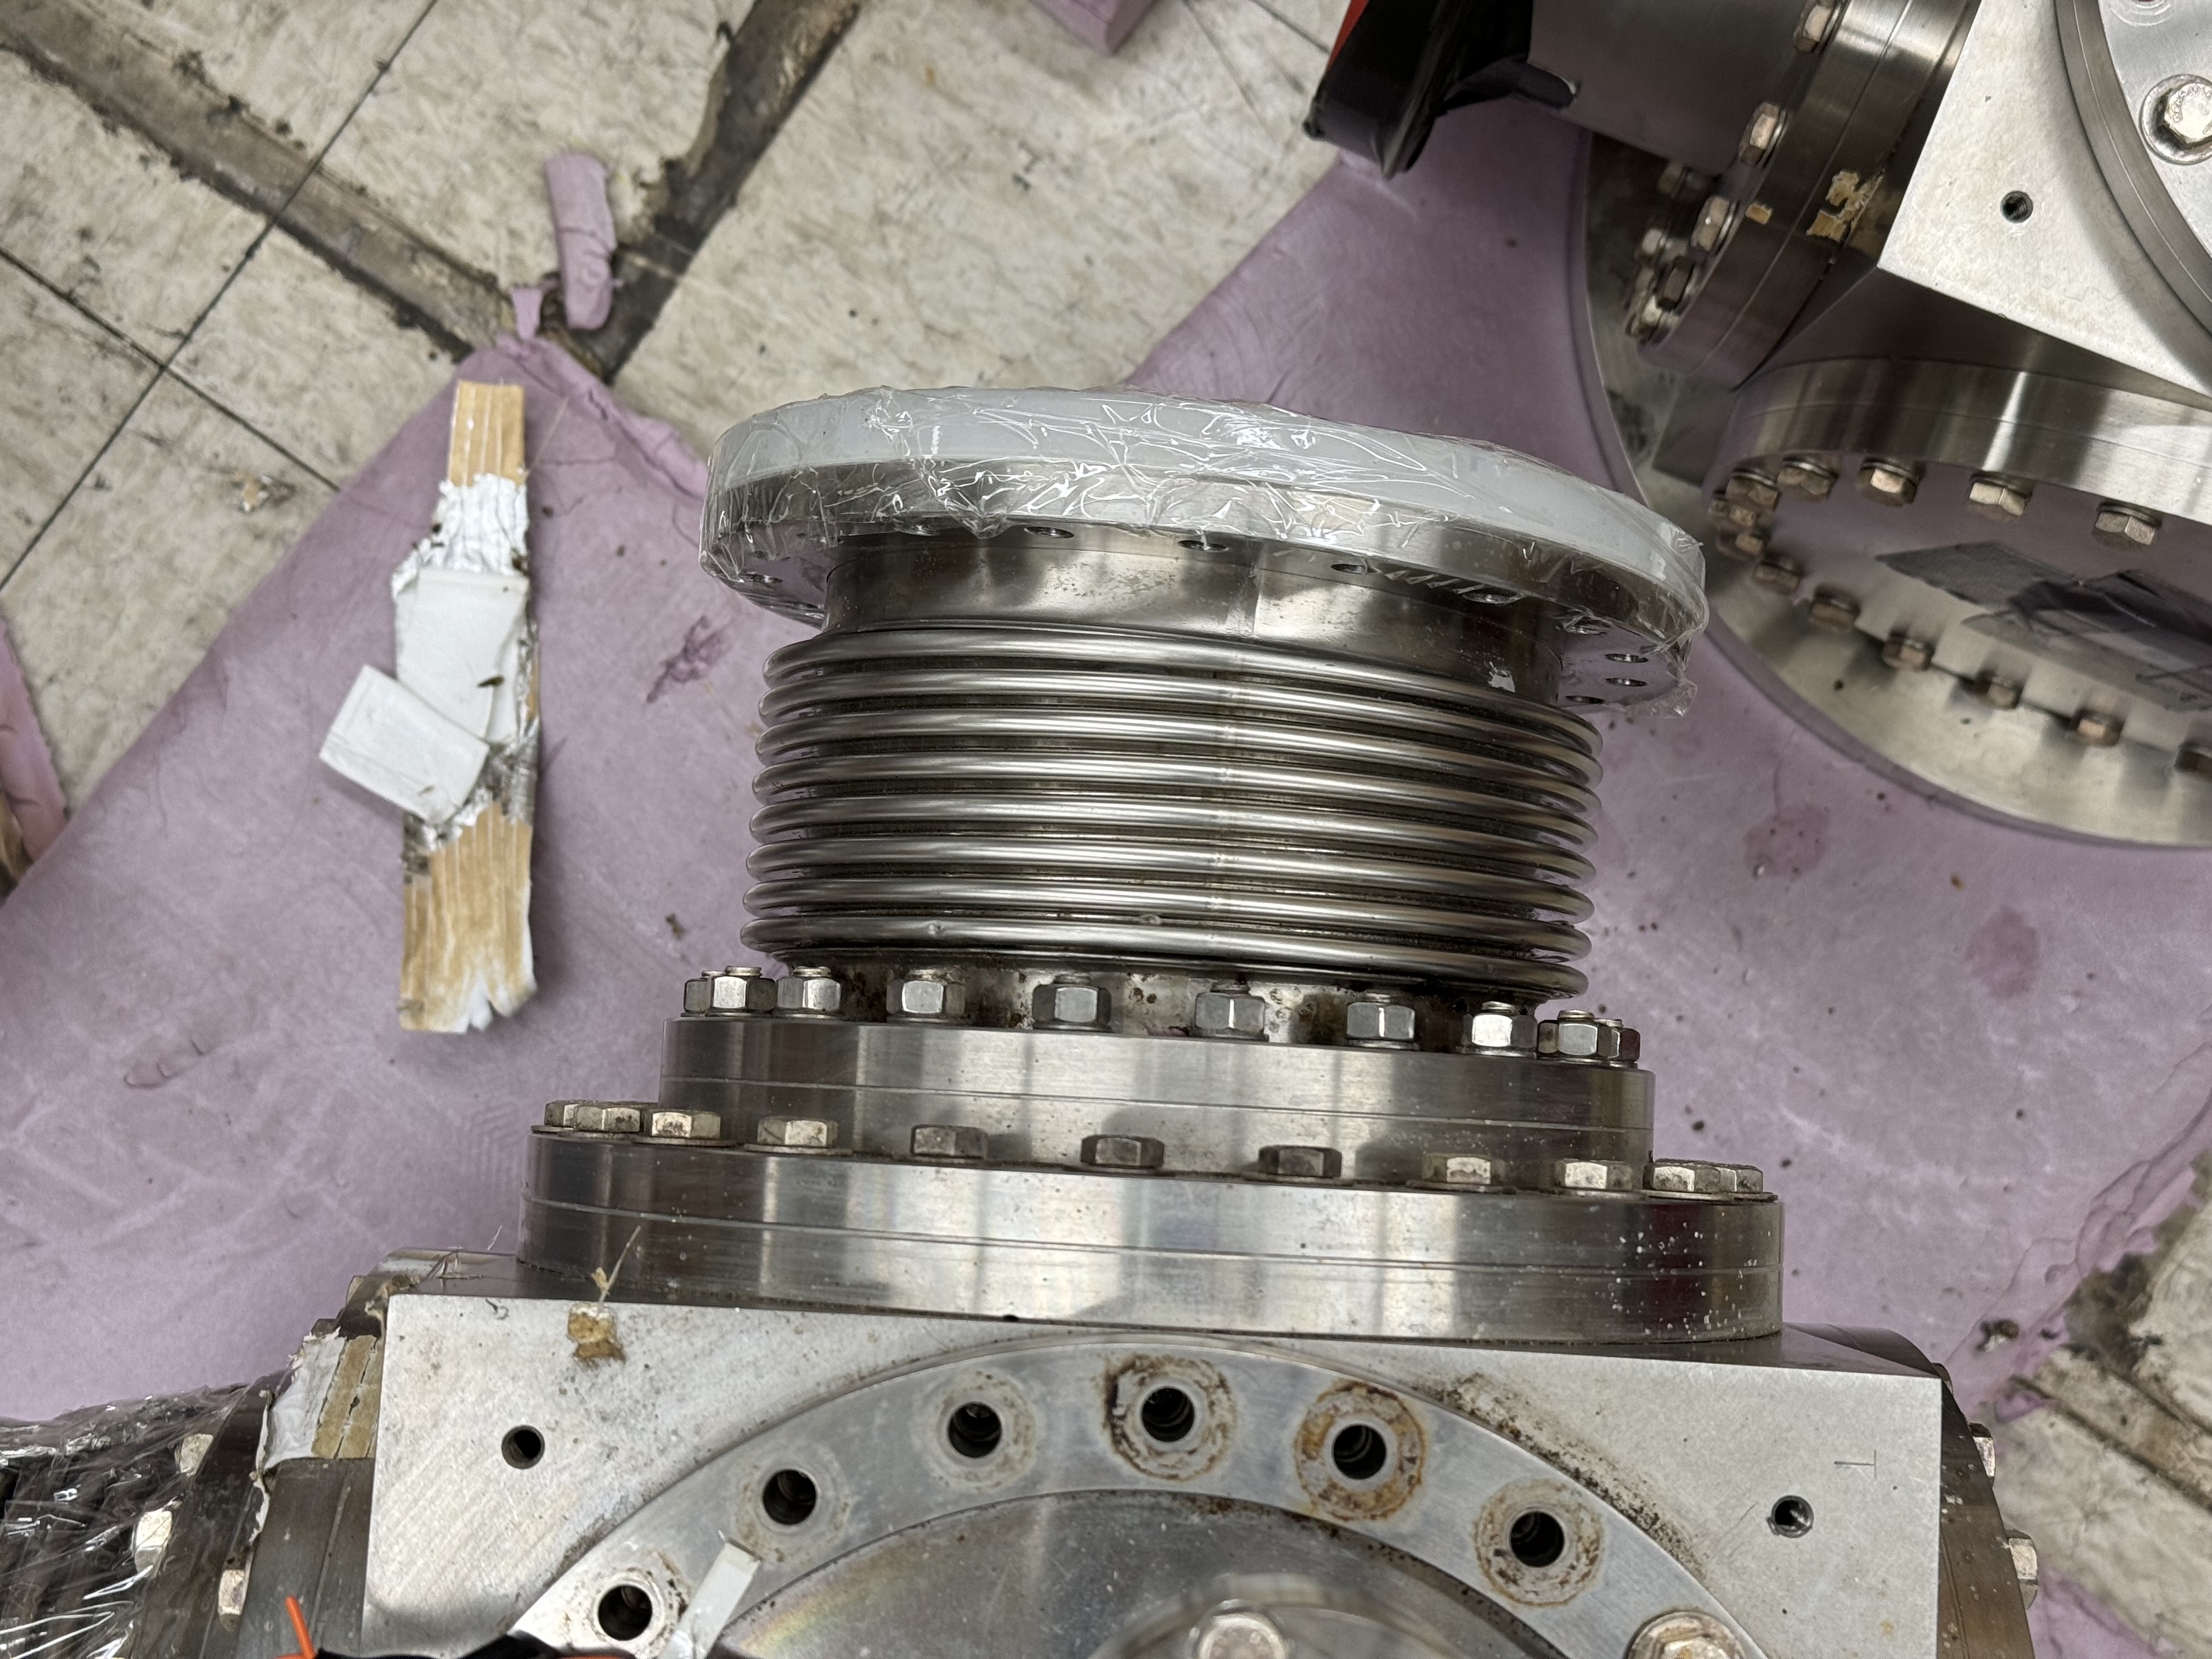
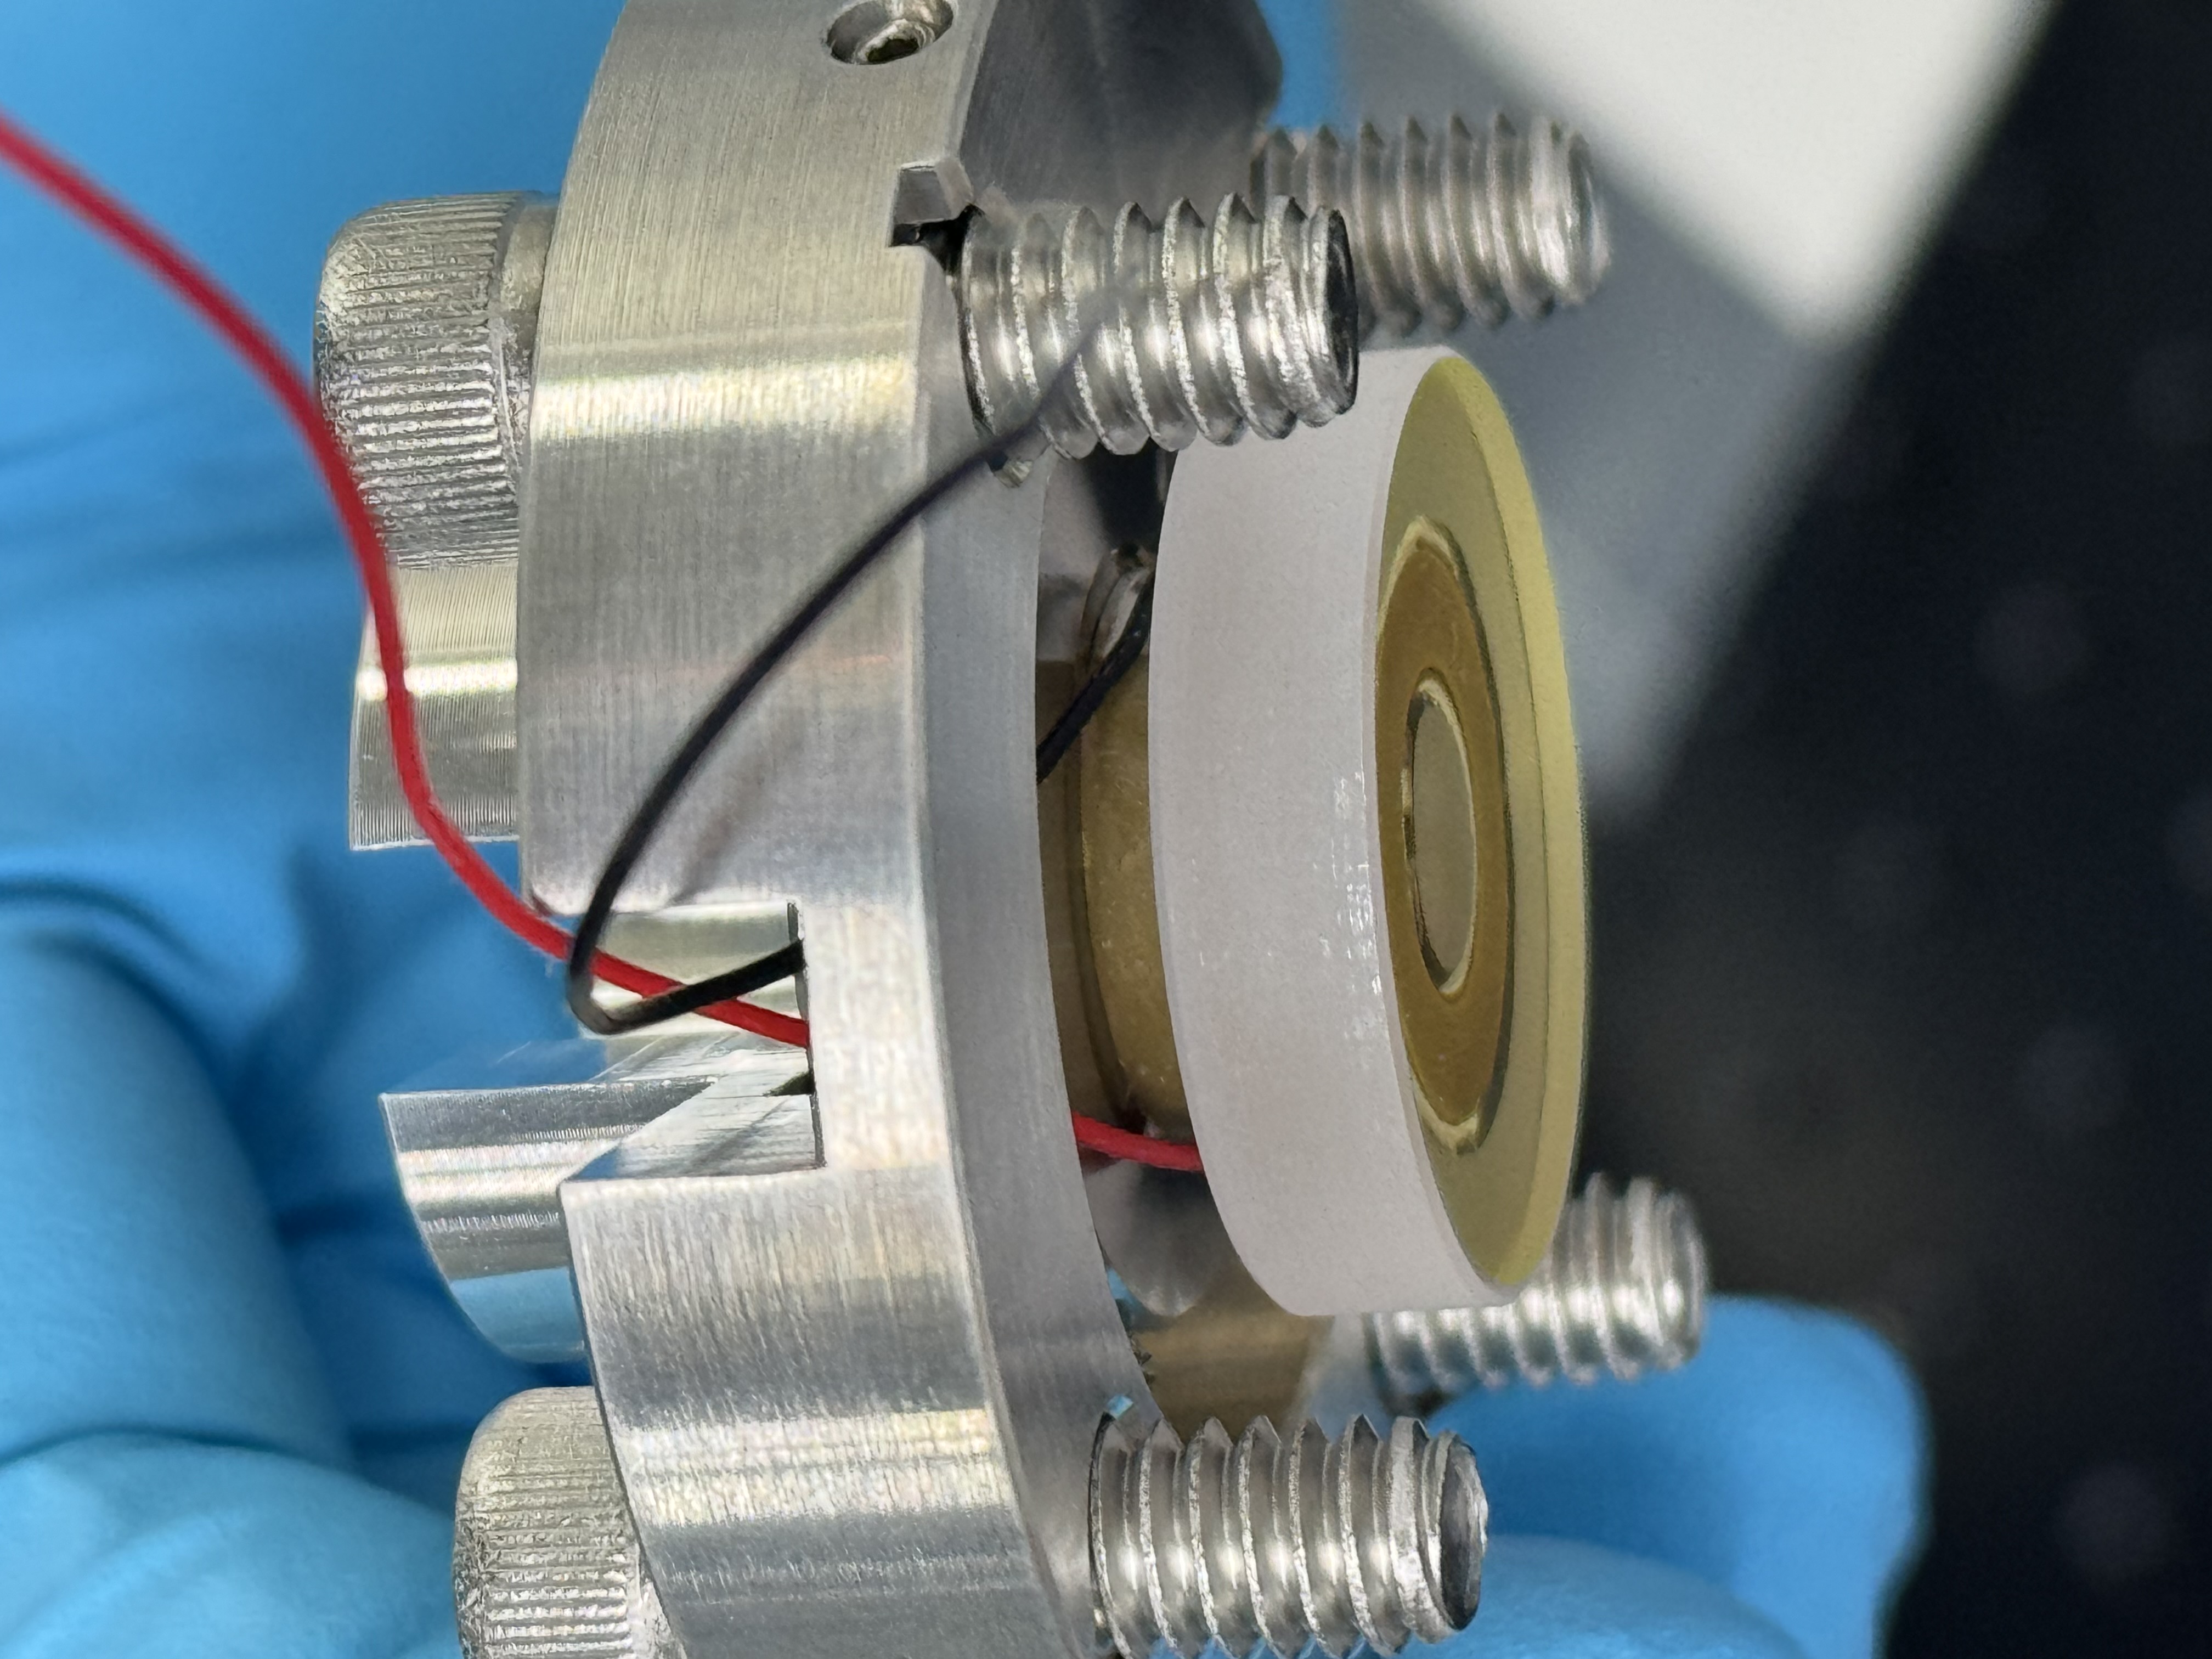
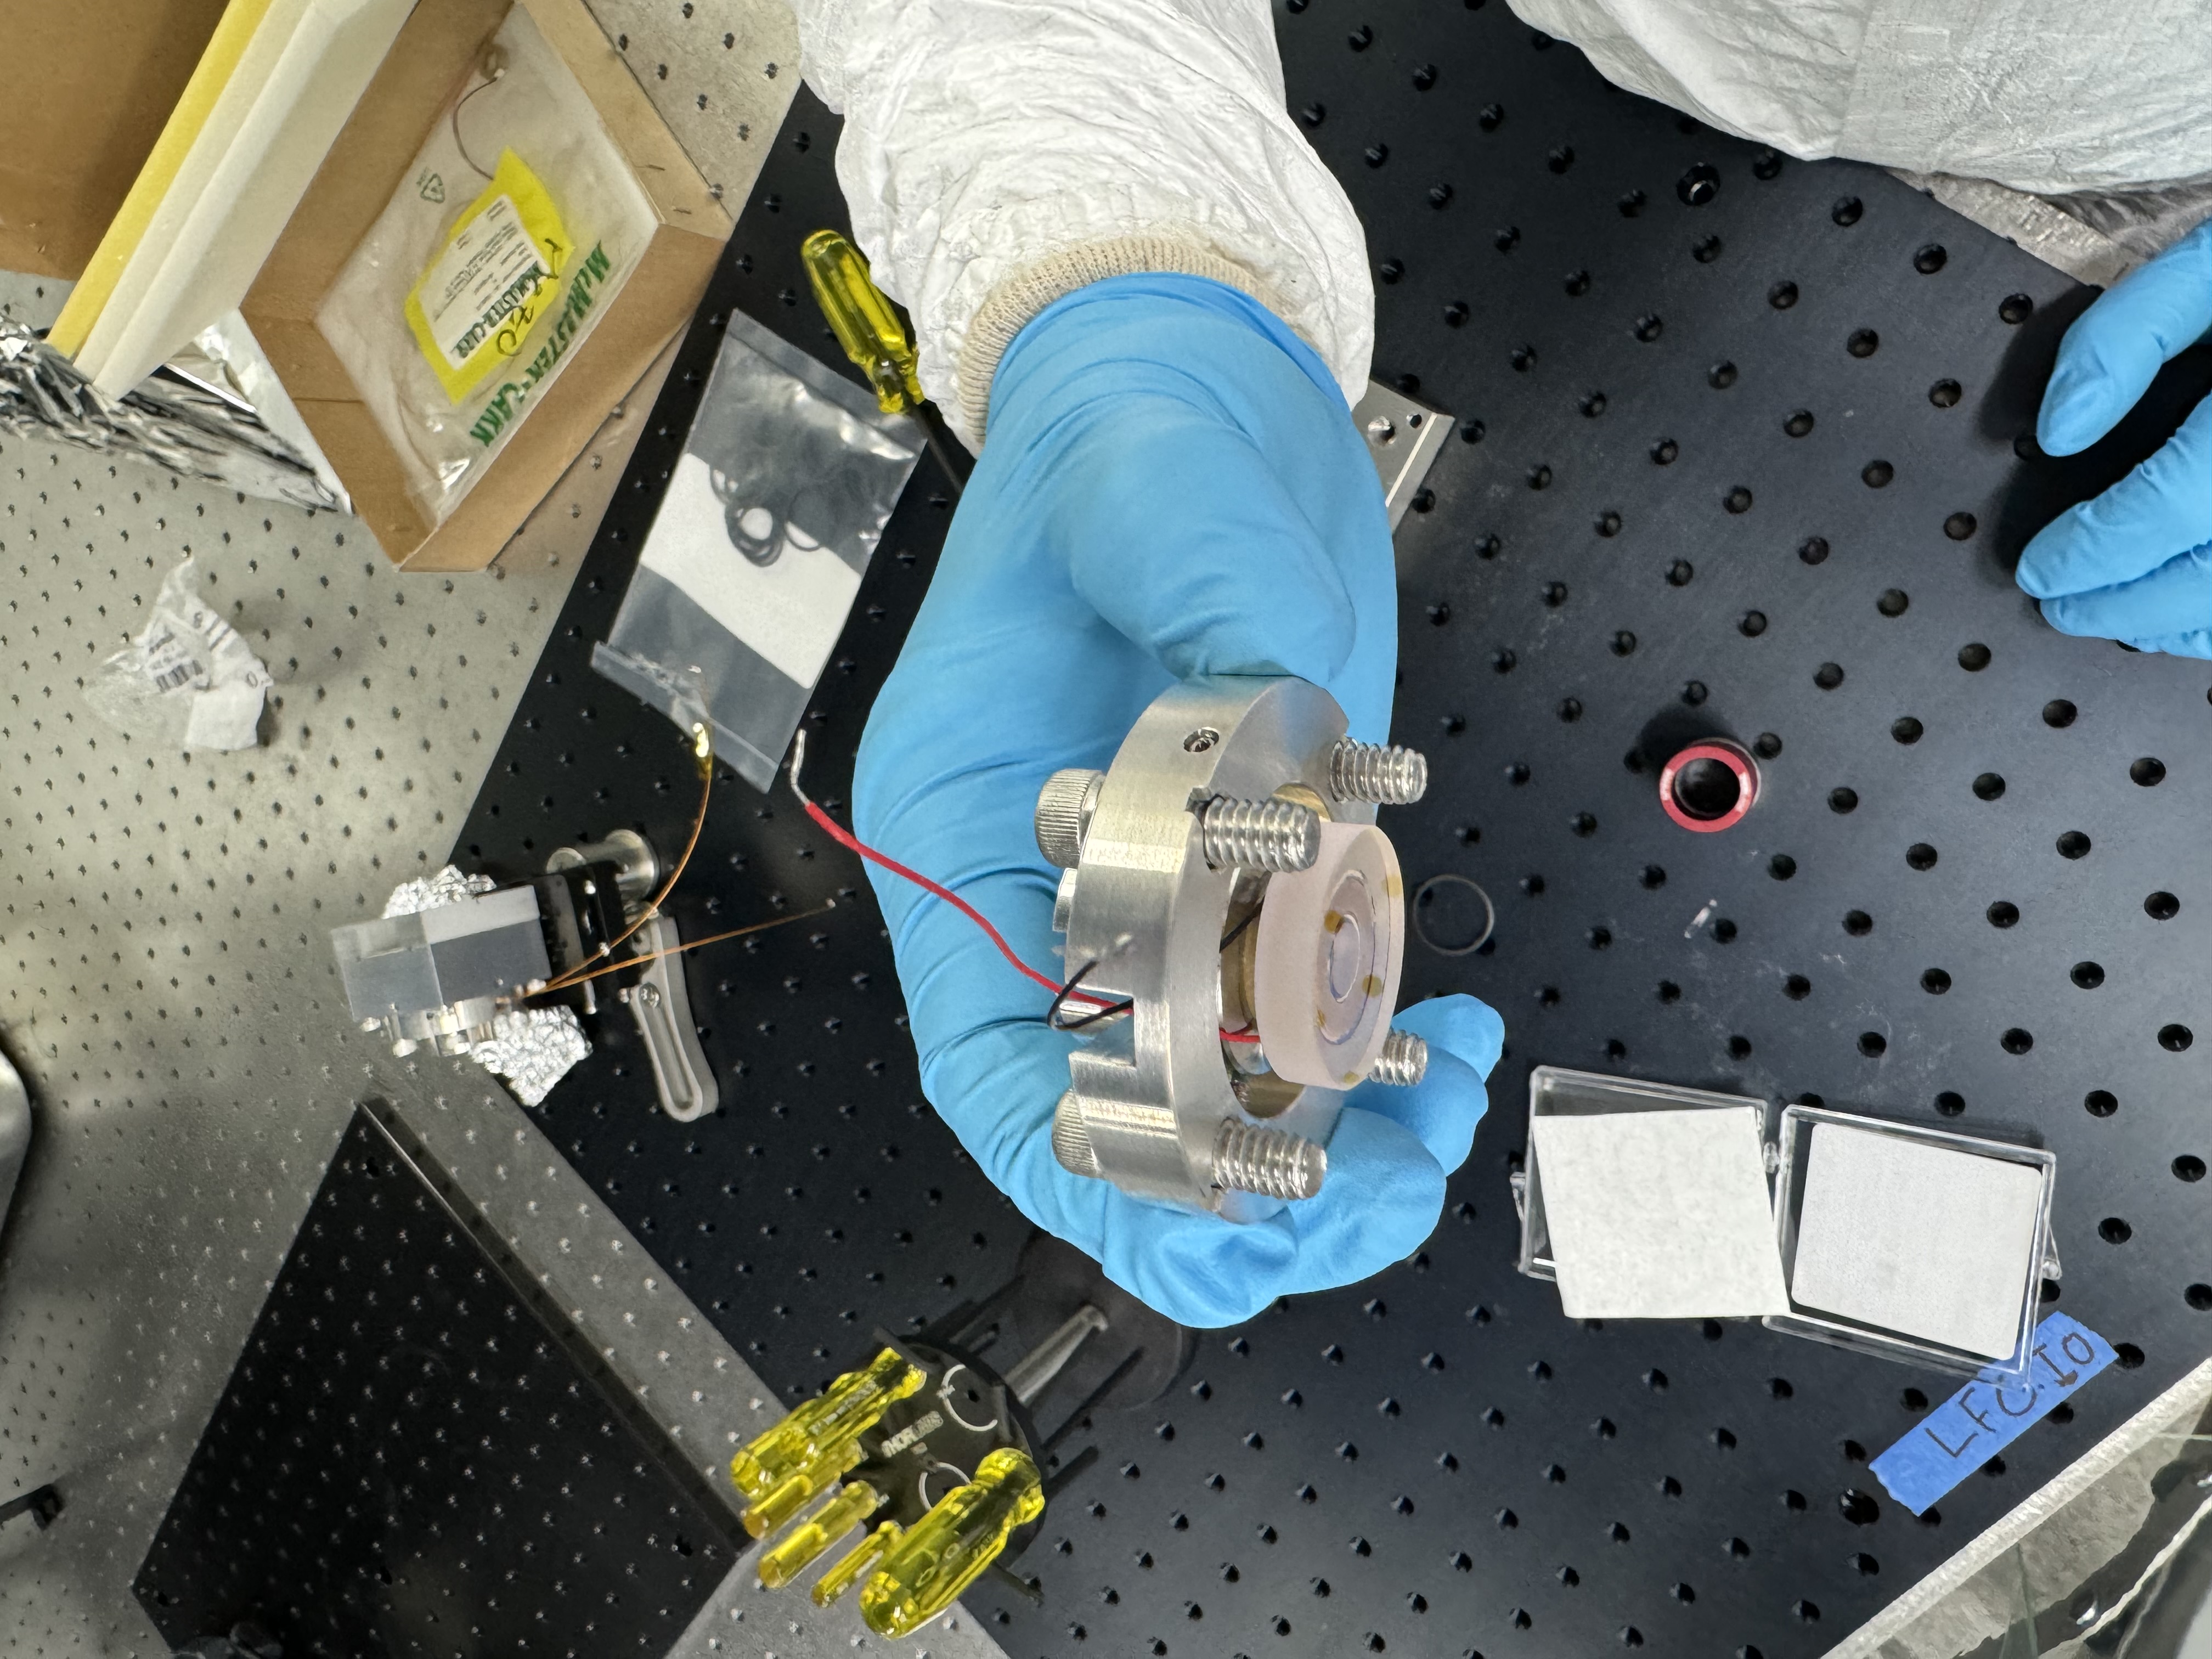
Last week, I damaged the corner of one of the BS Cubes (the 10:90 R:T 1550 nm cube) in the Power Distribution during assembly. Luckily, the damaged is confined to just the corner. See attached photos. In responce, I decided to build an assembly area. See the next post.
Images attached to this report