[Briana, Ian, Torrey]
Ian suggested that one reason why the tank circuit didn't work was because the capacitance is actually 12 not 14 picofarads based on the spec sheet that came in the EOM box (linked in a previous log post). This changes the inductance from 139 nH to 119 nH, which may be within the tolerance of the inductor we used but might still amplify the wrong frequency.
Thanks to Ian and Torrey for realigning the pump before I destroyed it. We are trying to mode-match the pump and probe beams through the vapor cell (concentrate more pump power to sharpen the dip), so using JamMt and beam profiling, two lenses (150 mm and 100 mm) were added to the pump path to reduce the beam size down from ~1600 microns to ~1300 microns. One issue is that once the light passed through the EOM, the beam profile began to look more clipped, so the x and y beam diameters were not the same and changed drastically. I think this is because the beam passing through the EOM is not constant in the z-direction, so more fine-tuning is required that I was not able to finish in time. By tuning the position of the EOM, the beam size can change significantly, so it is almost certainly the EOM alignment causing this issue. Currently, from the beginning to end of the vapor cell, the probe beam has a (x,y) beam profile of (1349, 1455) and (1405, 1545) microns respectively. For the pump, this was (1368, 1361) and (1383, 1386) microns at the beginning and end of the vapor cell respectively.
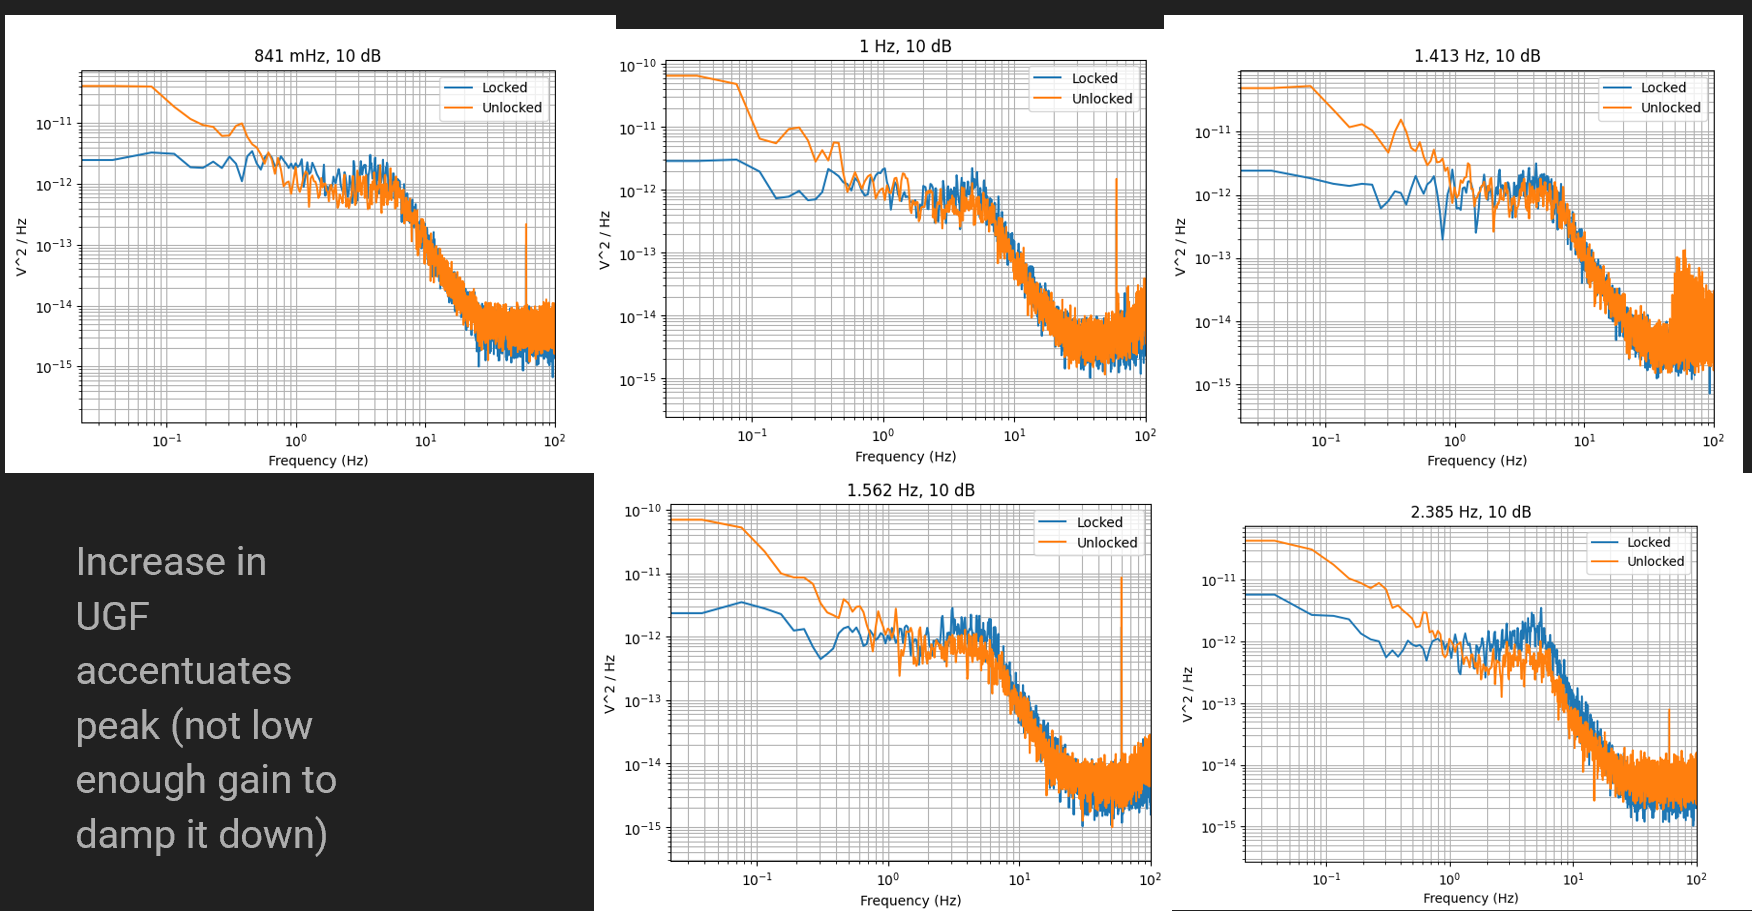
Spent some time varying the slow controller and there exists a peak around 40 Hz introduced by the locked laser (potentially due to the controller but unsure otherwise): example_peak_pt2.png, strangepeak.png show some different controller parameters. If you reduce the unity gain frequency and the gain, this peak gets damped down, which makes sense because the gain will be lower at that frequency. This peak could be a result of us driving the system at this frequency that is in resonance with something in the system, kind of like when you have a spring and you drive it at the right frequency to increase the amplitude but once you are at higher/lower frequencies to this peak you have a lower amplitude.
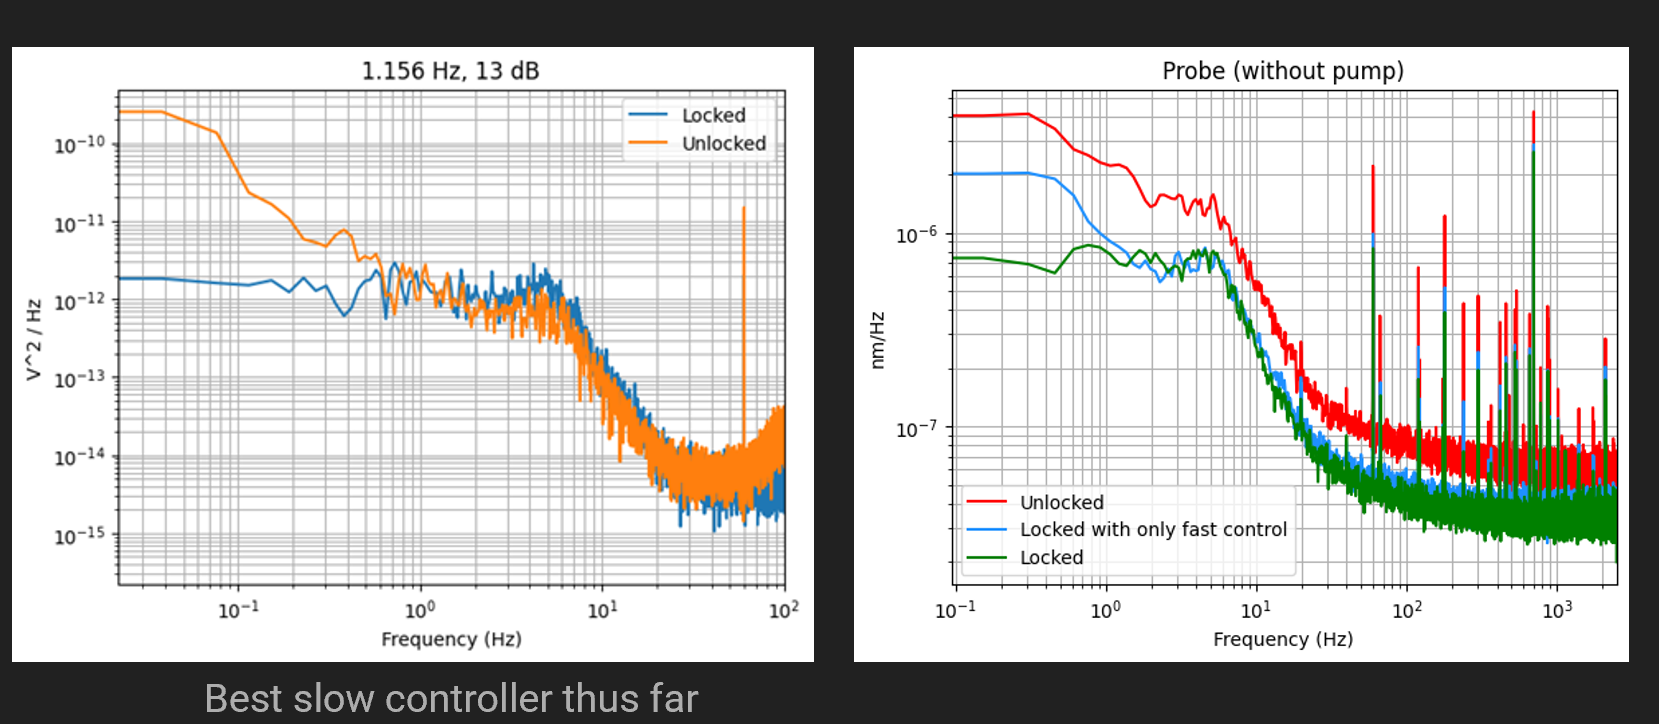
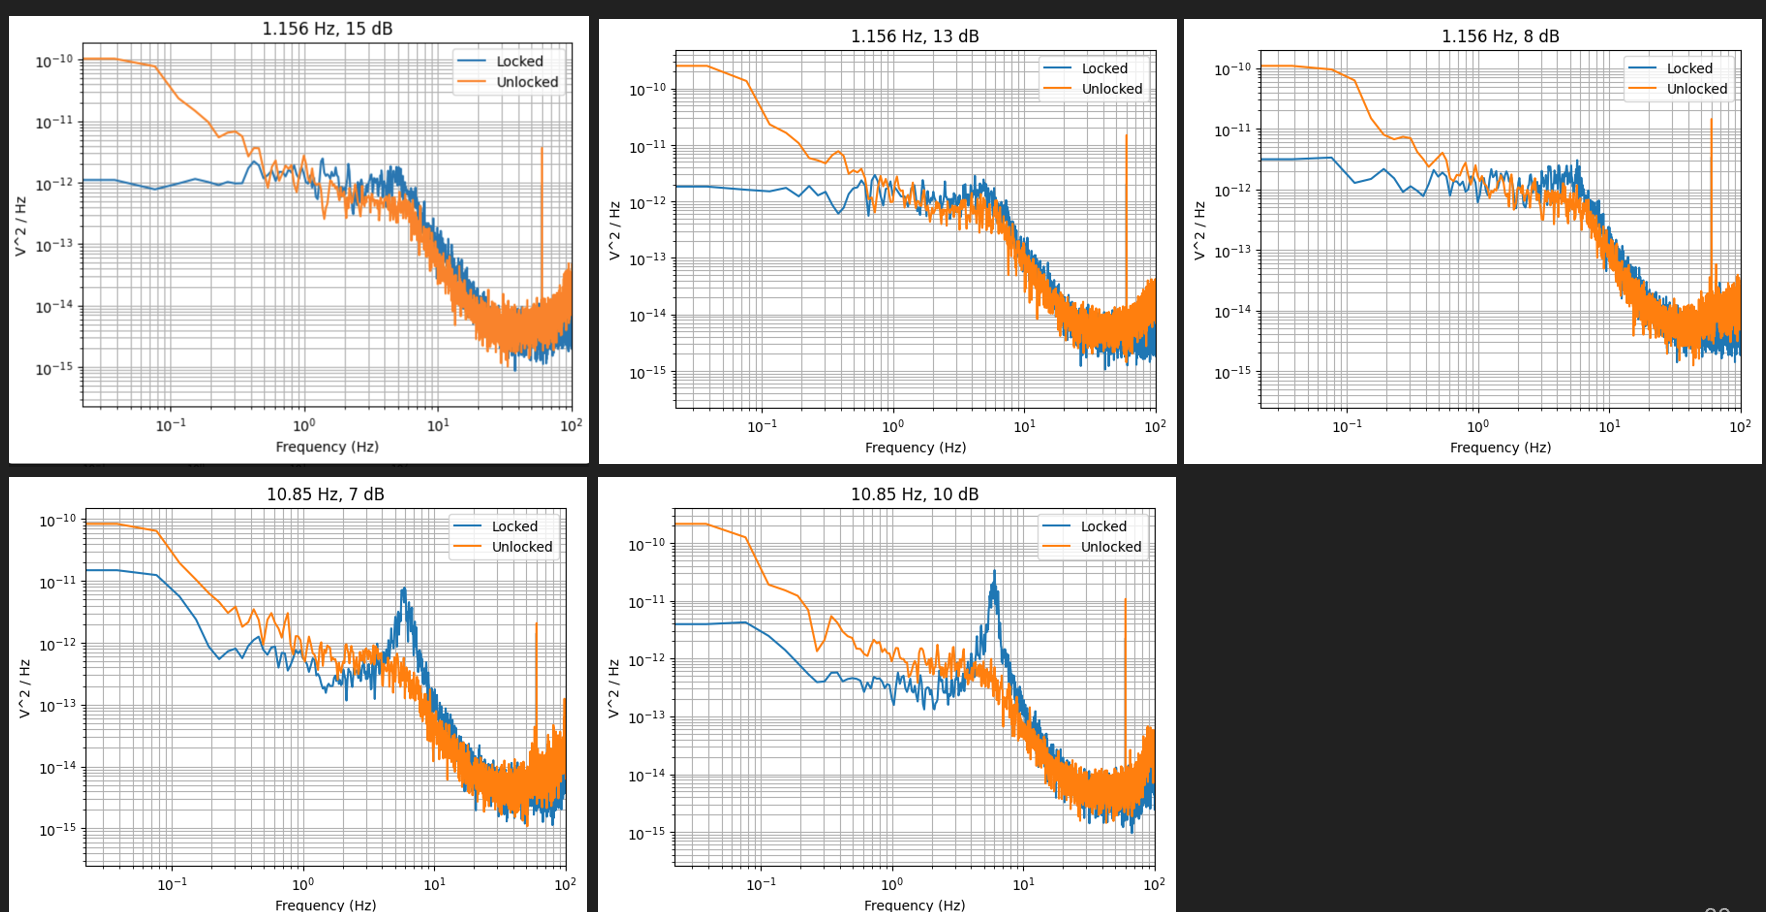
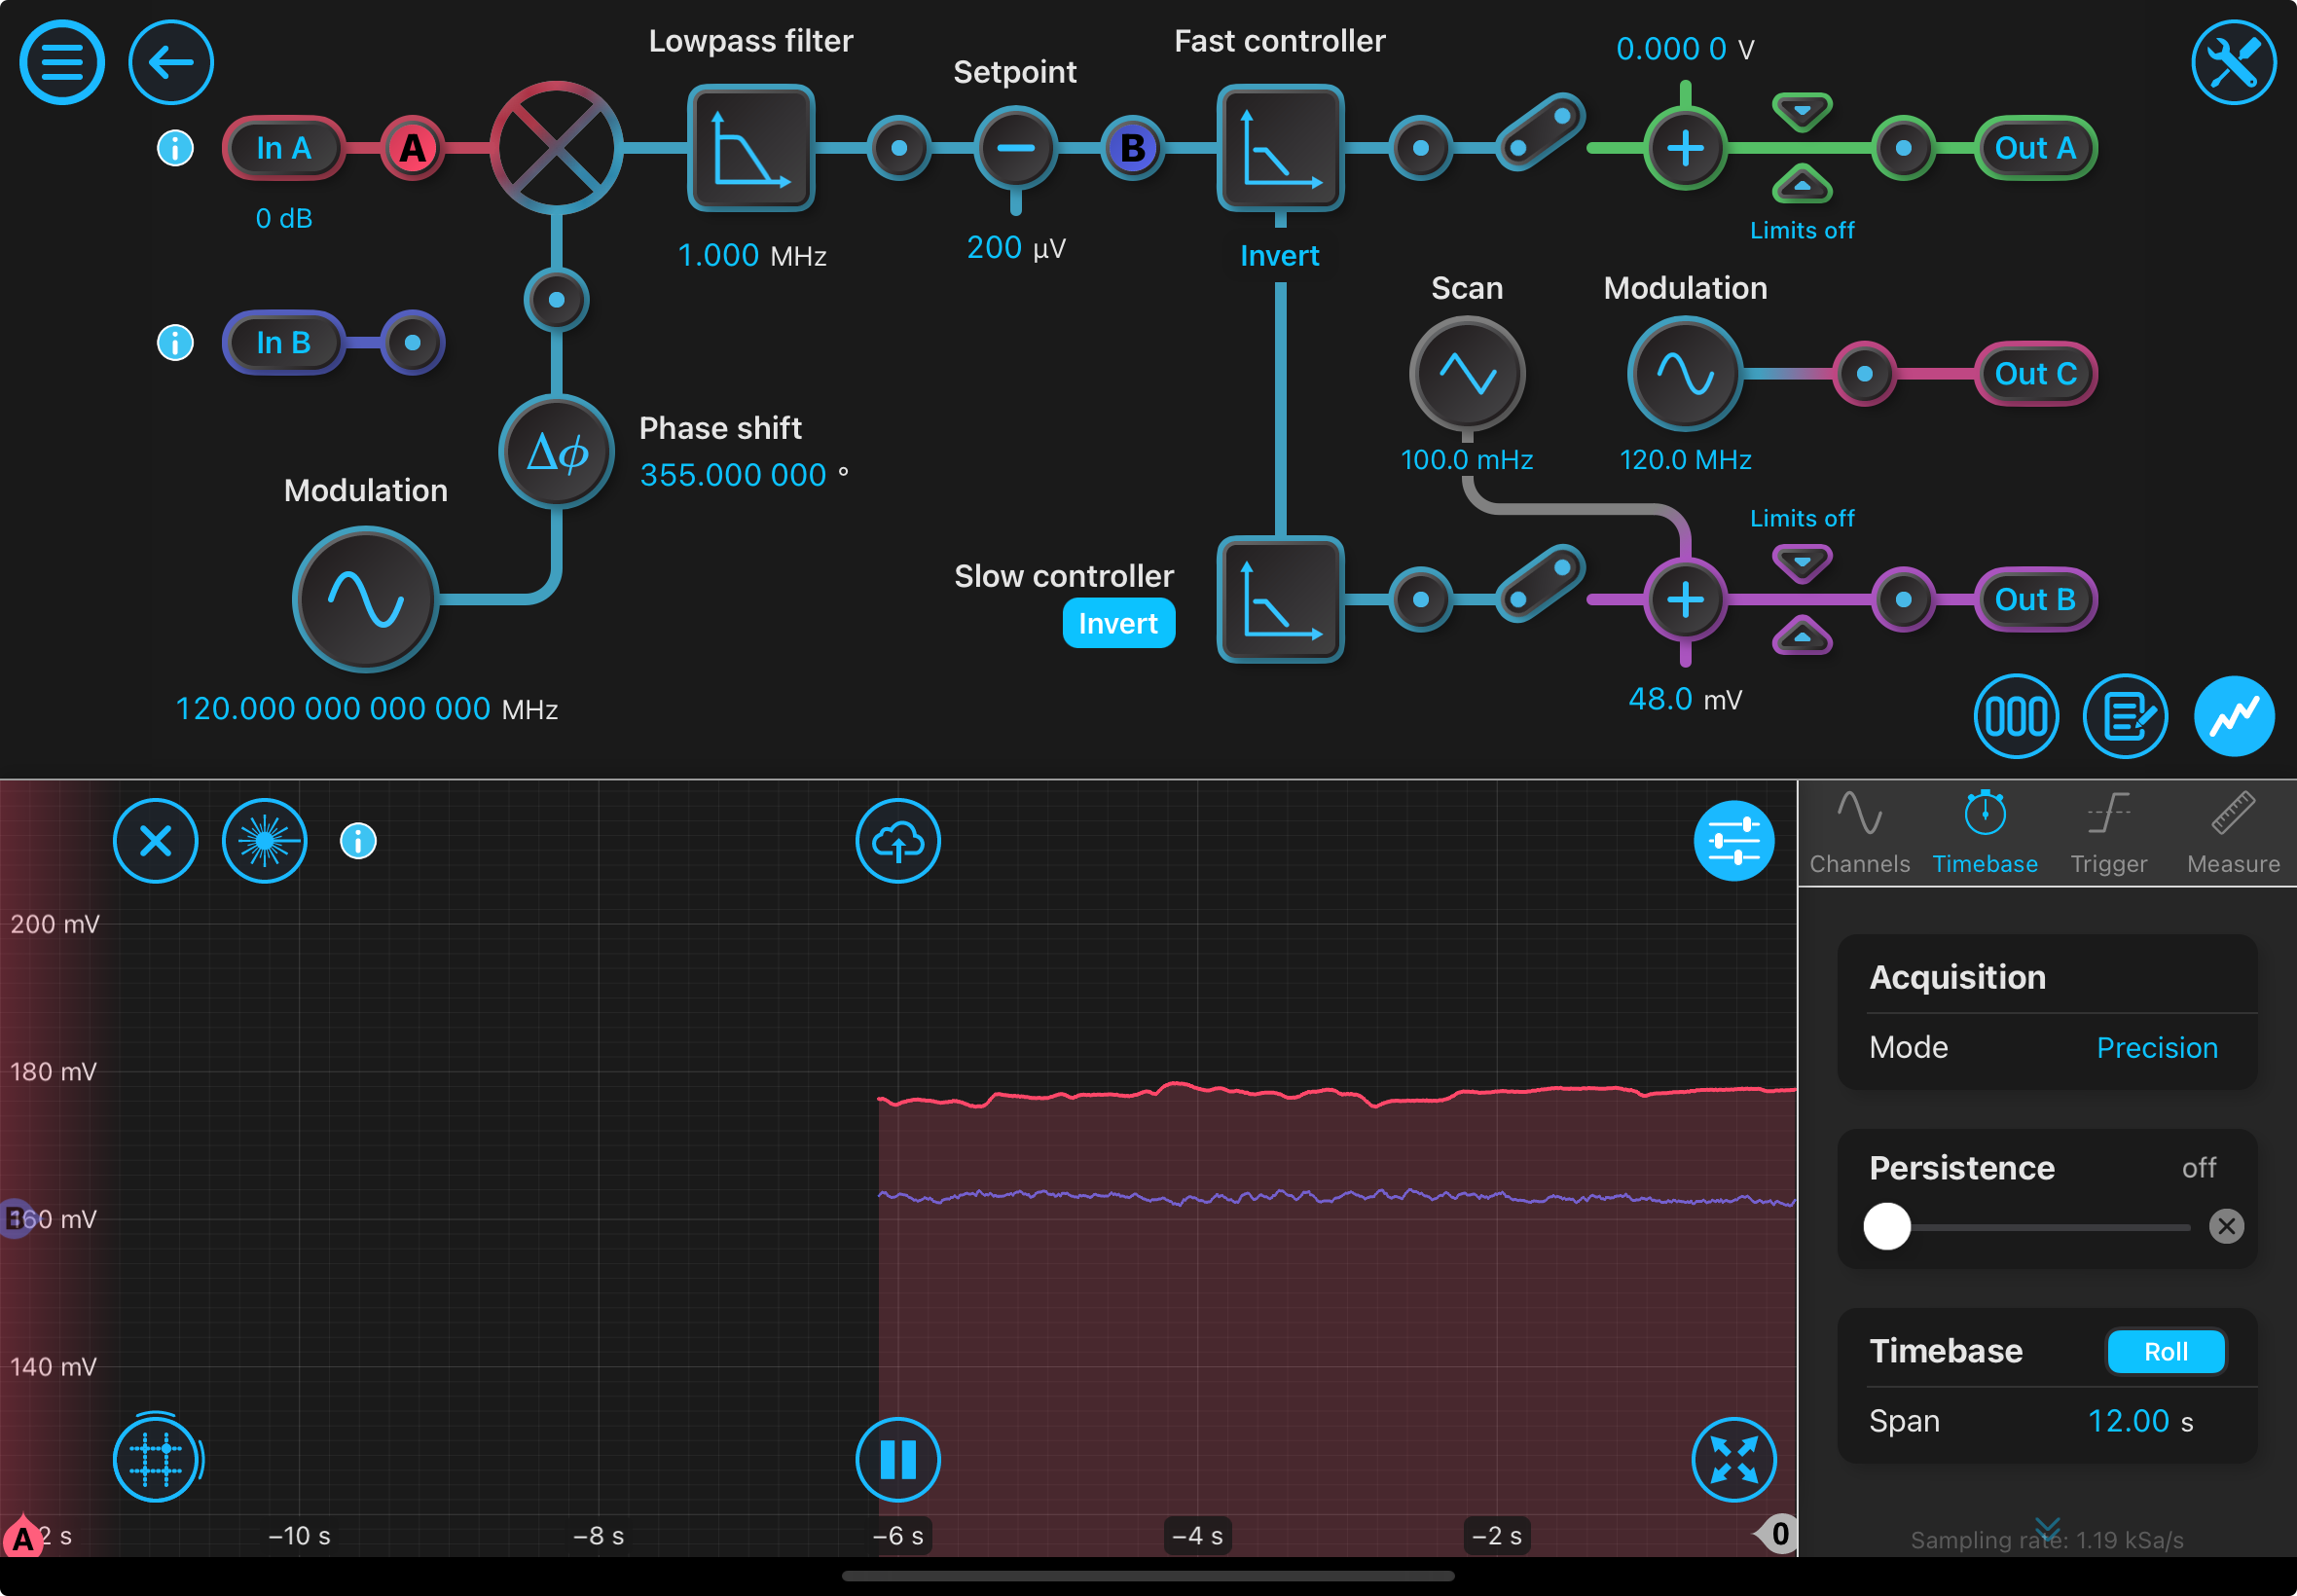
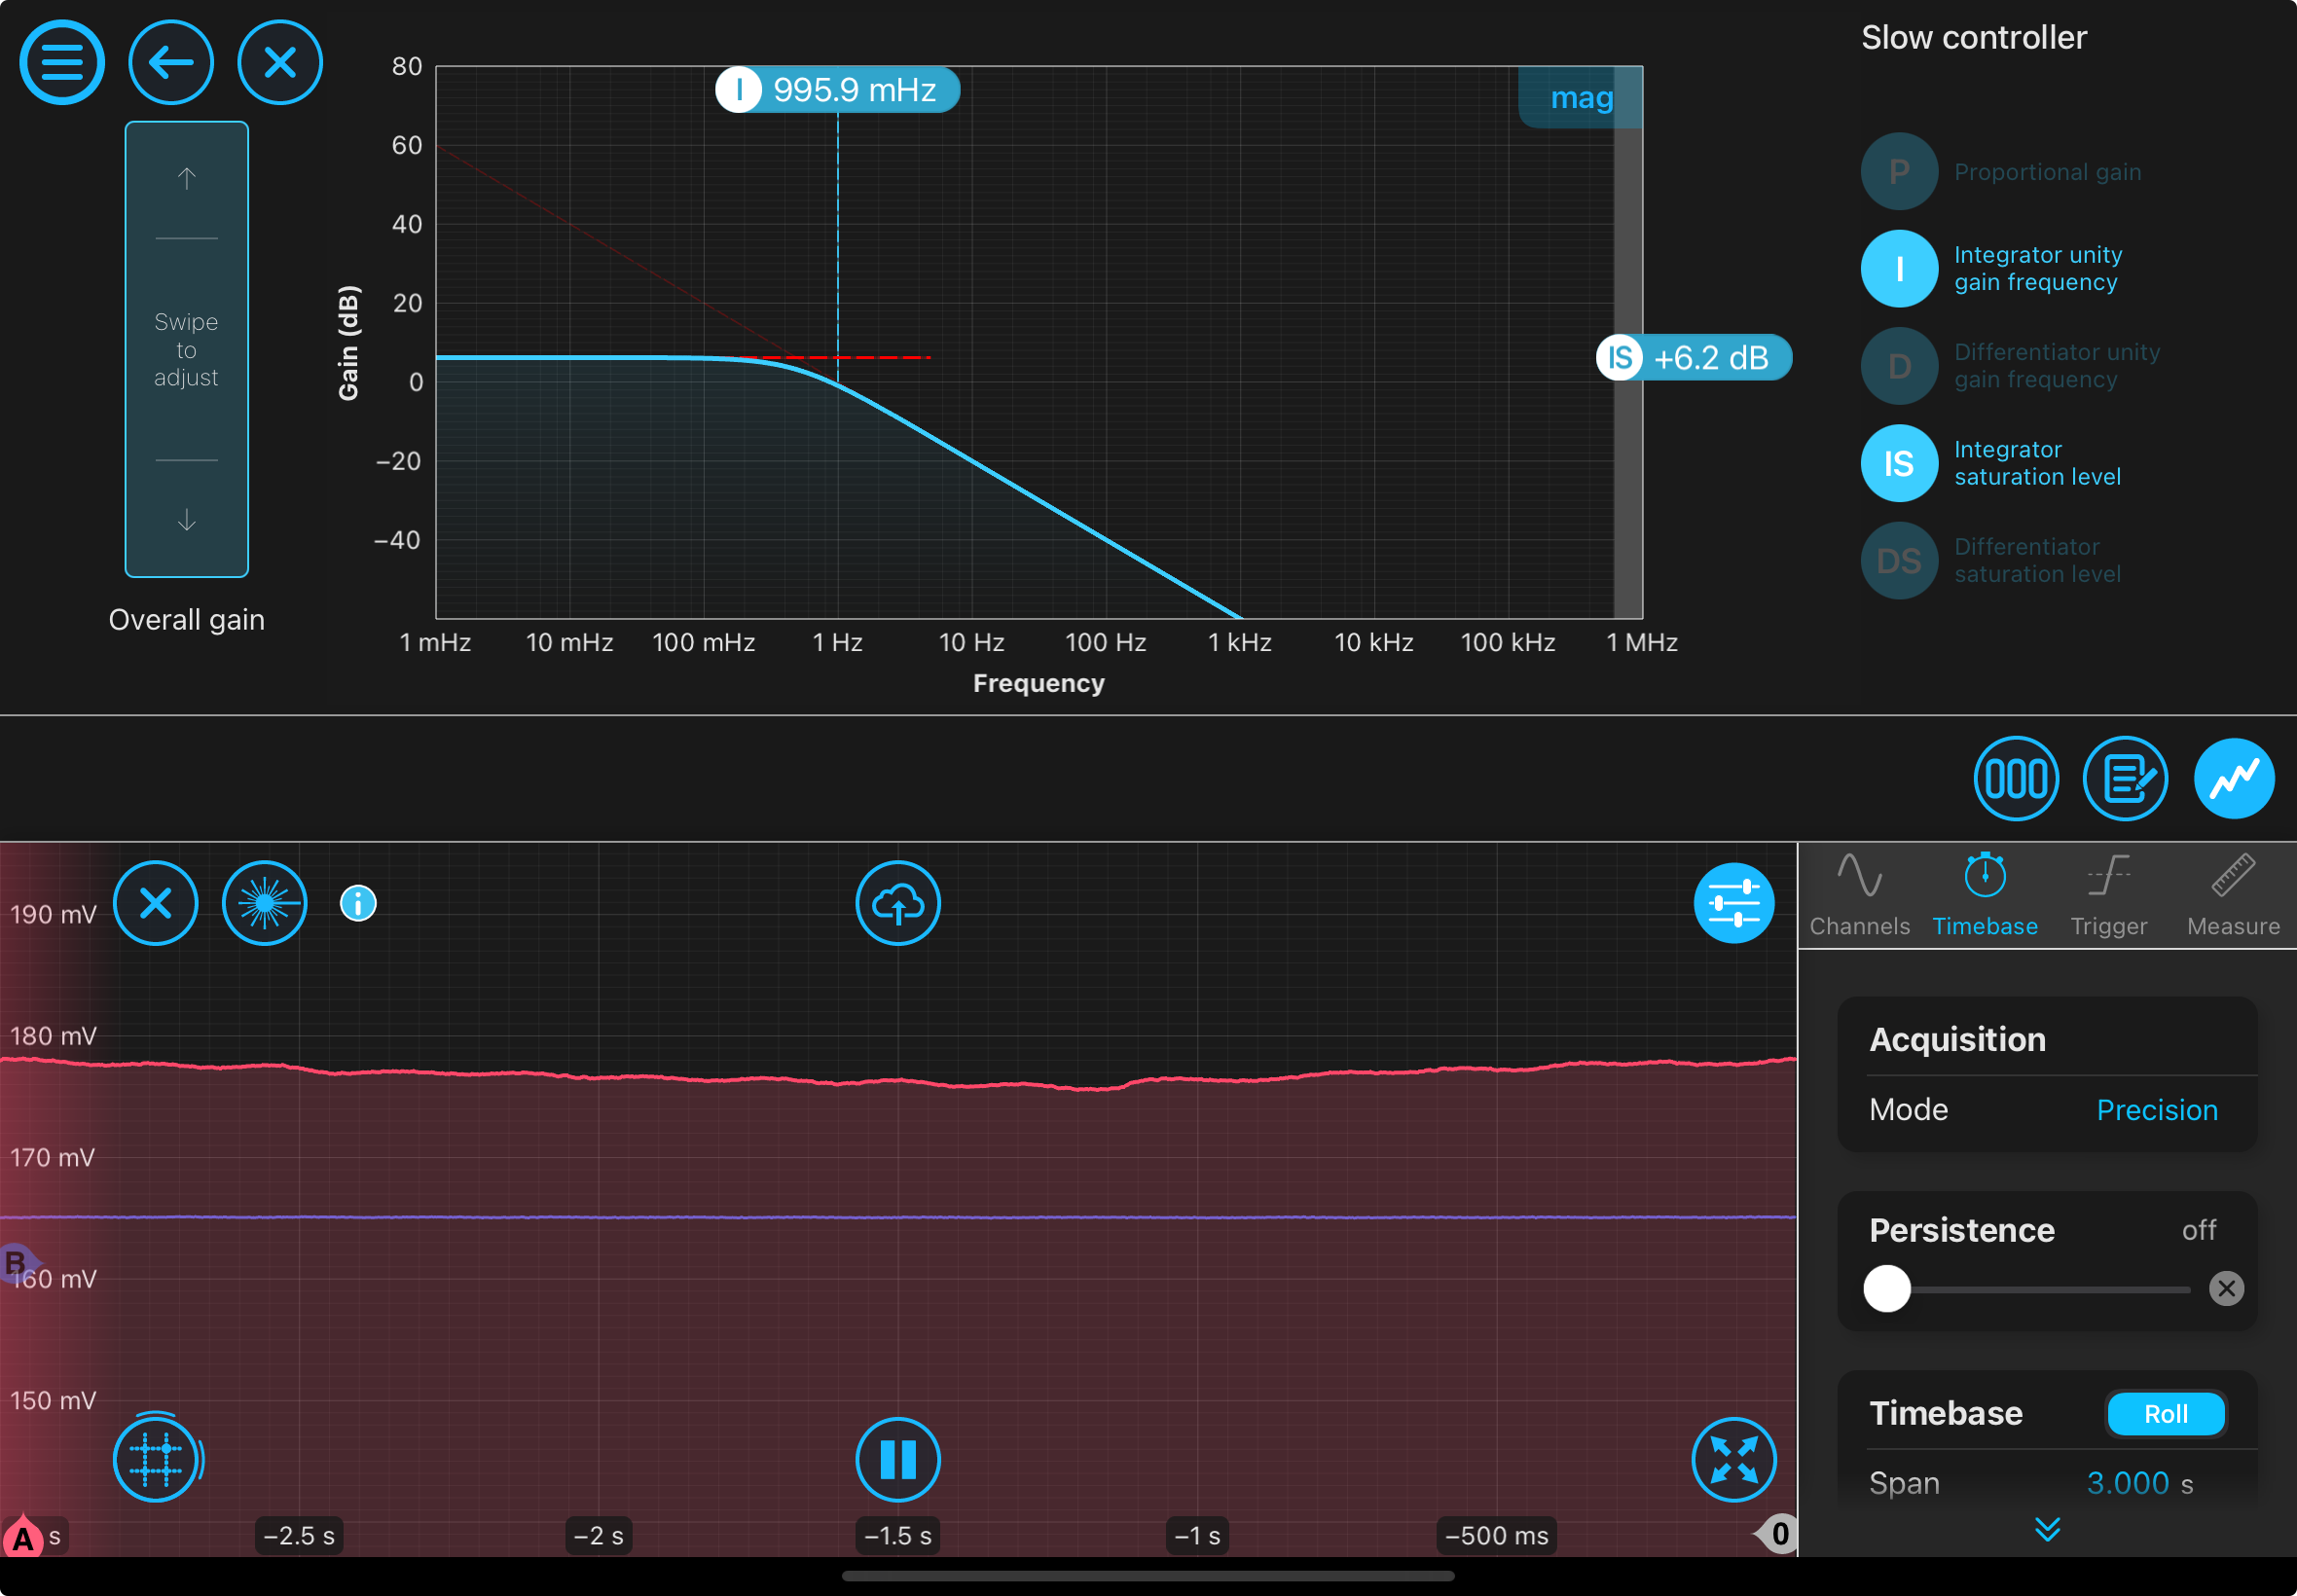
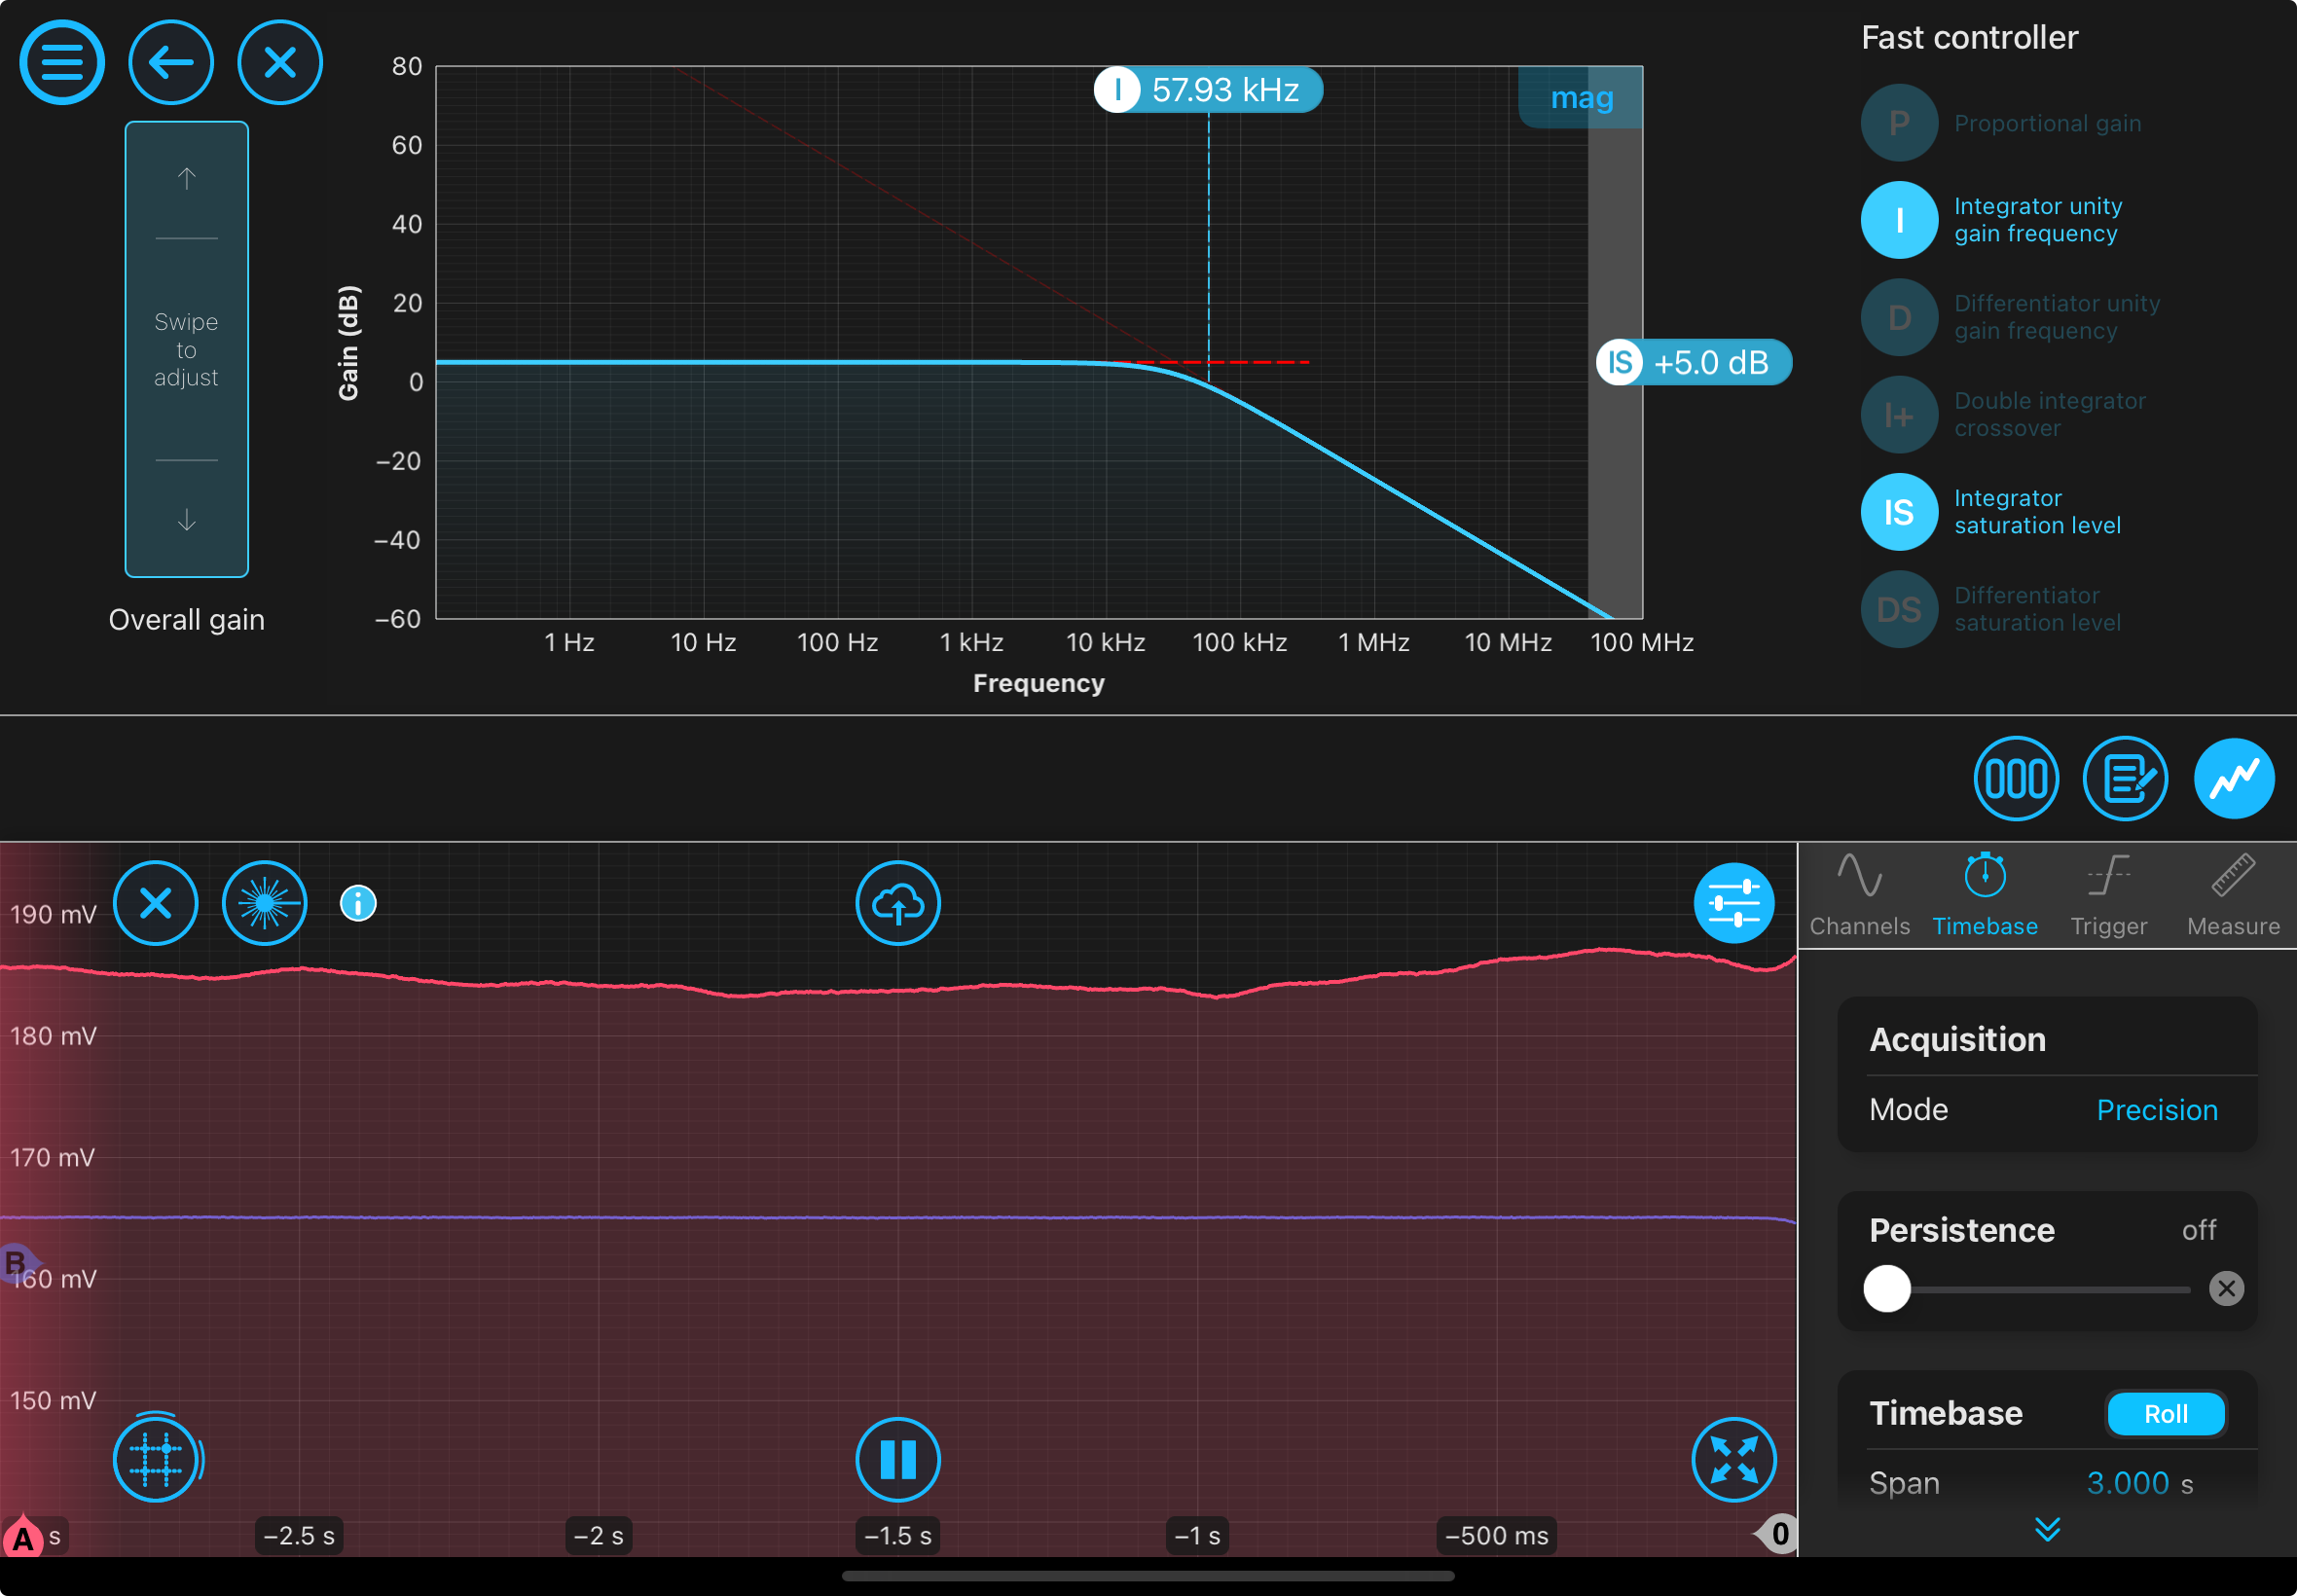
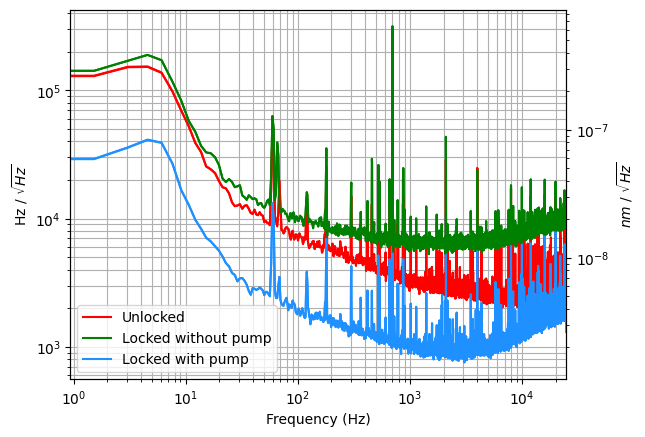
We achieved fast actuation by changing the current controller. We previously did not implement this because we thought power fluctuations might become too significant. We also failed to do so initially because we needed to amplify the signal to the current controller by +14 dB in the Moku settings. On 8/21, we took data with the fast controller but the error signals looked extremely bad: horrendous_dip.png, plateau_errorsignal.png. Although the calibrated error signals for the 8/22 data also looks ugly, this one is worse because the error signal strangely plateaus. After plugging in a terminator to the BNC cable and unplugging, this plateau no longer occurred. This points to the potential fluctuations in the current controller due to the new connection from the MOD OUT port with the BNC cable. Still, the data from 8/21 shows that the slow controller is doing something. By locking and then unlocking the slow controller, we get the noise spectrum on the right side of this image: slowvsfast.png. The following are the settings used to take this data: settings.png. The controllers used were shown here: slowcontroller.png, fastcontroller.png.
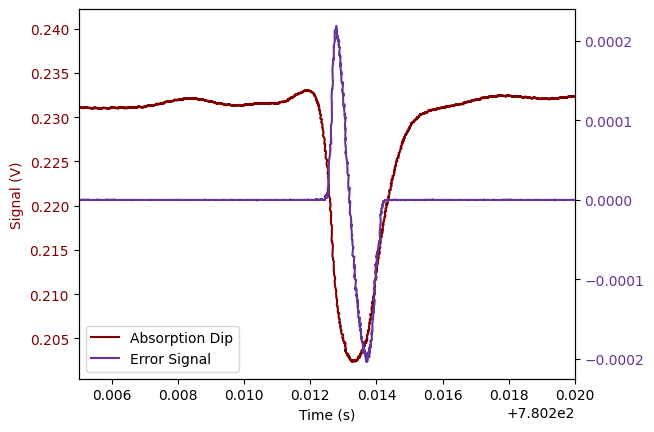
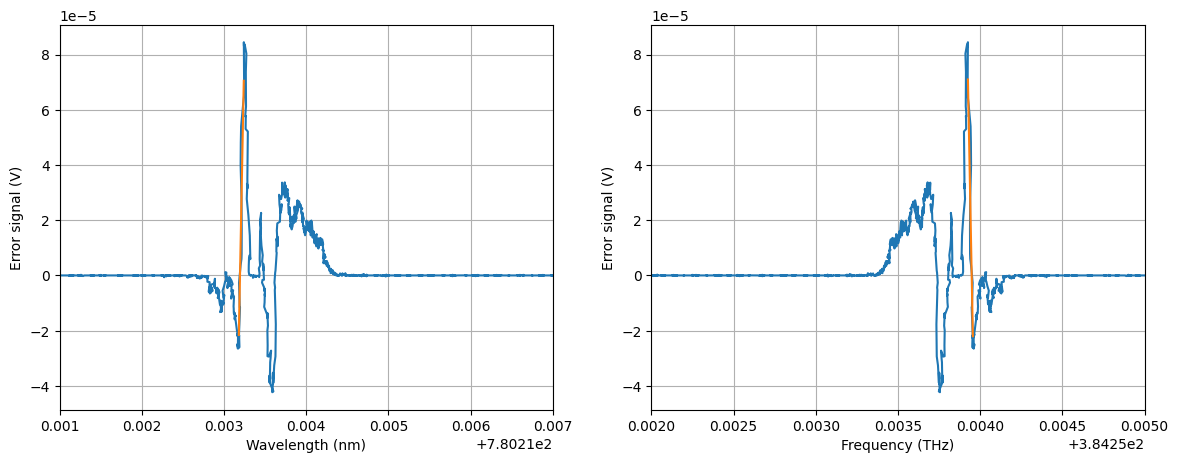
The following is the error signal used for the 8/22 data. When the signal is not calibrated, it looks pretty smooth: uncalibratederrorsignal.png. Upon calibrating, the overall error signal looks bad: uglyerrorsignals.png. This is not because of the sample acquisition rate. I am pretty sure this is because the current value may be fluctuating now that we have it connected to the BNC cable/Moku. What we can do to test this is to plug in the current output to a Moku input, convert that voltage reading to current, and perform the interpolation for current similar to the one we do with temperature using the laser specs. This calibrates using a potentially varying current value along with the varying temperature value. Doing this would require three data loggers though, which is not super efficient.
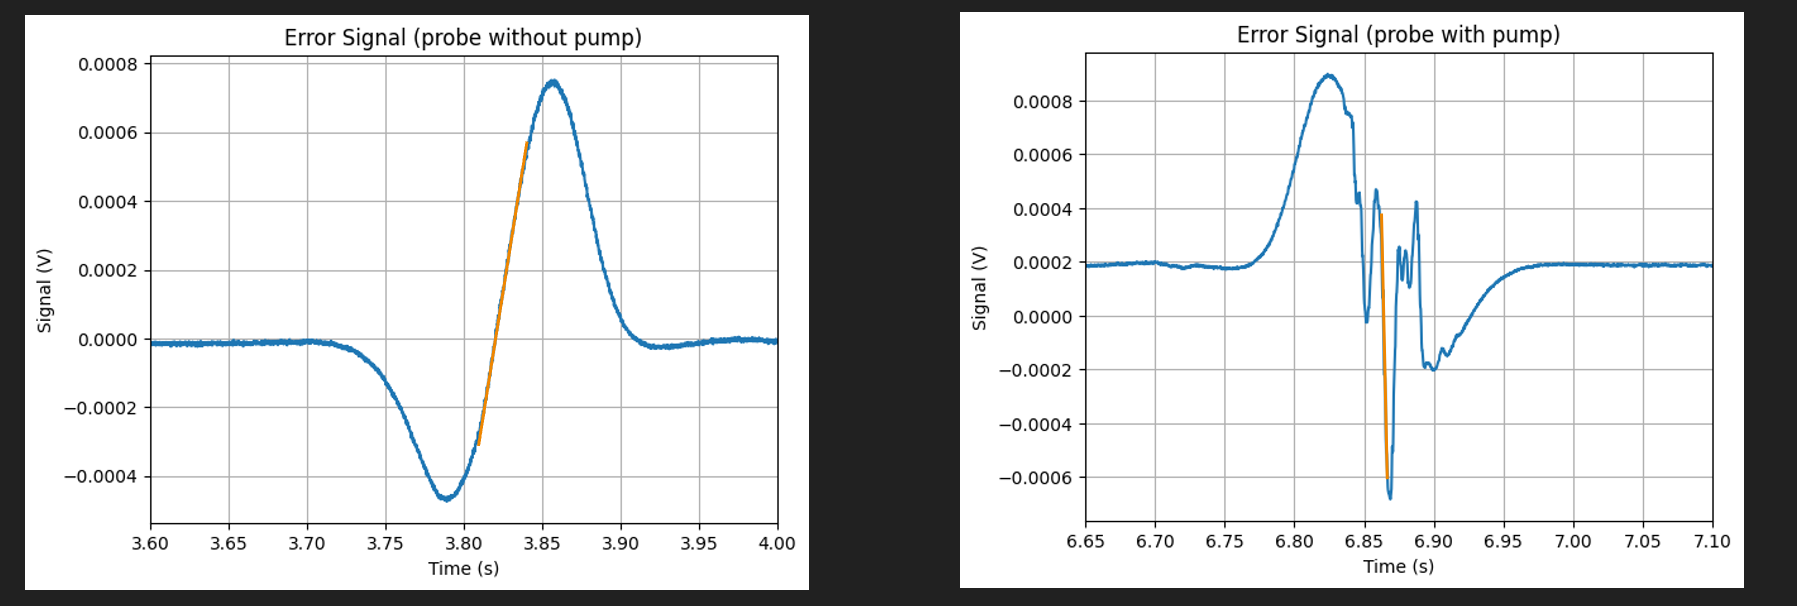
On 8/22, we retook data after fixing the error signal plateau-ing. We obtain the following noise spectra: Probe(withoutpump).pdf, Probe(withpump).pdf, which matches what we expect with a lower noise in the locked laser. The controllers used to lock are: slowcontroller_822.png, fastcontroller_822.png. After calibrating with the error signal (which gave us slopes of ~3.4 V/THz and ~21.6 V/THz for the probe and probe with pump respectively, showing the improved frequency discrimination), we get the following noise spectra: NoiseSpectra.pdf. This seems good but we should keep the following in mind.
- We obtain a measure of an unlocked/free-running laser using the unlocked probe (after locking) as the free-running laser. For the random free-running laser, we need to have an error signal to calibrate against to get our units in the Hz/sqrt(Hz) for actual comparison. Actually, when I used the calibrated unlocked pump spectrum compared to the calibrated unlocked probe spectrum, I get this, where the unlocked case actually has less noise than the probe without pump locked case: unfortunate_pumpprobeunlocked.png. This could be a result of error in the slope of the signal (back to our calibration issue). Pump and probe unlocked cases should have the same noise after calibration though.
- It is hard to lock the pump (you sometimes have to get lucky) because although the slope is steep, it is not high enough in amplitude to span a large detuning range. A greater frequency variation will thus immediately break lock. This is why we want a greater error signal amplitude and is something to work on.
Some other to-dos:
- Fix the laser polarization drift. Rotate the laser and then take an overnight measurement (notch of laser patch cable may need to be aligned differently).
- To maximize efficiency through the EOM, a half waveplate should be added to orient the polarization properly. This will require the addition of a Faraday isolator to the path before the EOM.
- Add pickoff to photodetector to divide out power fluctuations from polarization fiber issue.
- Add a lock in amplifier to the EOM or the photodetector signal. It may be nice to add it to the EOM because it would be ideal to chose a modulation frequency greater than the natural linewidth of Rb 87 (~300 MHz) so the sidebands are not affected by the intensity fluctuations. It we can amplify the strength of modulation beyond 200 MHz, we could be less susceptible to the fluctuations.


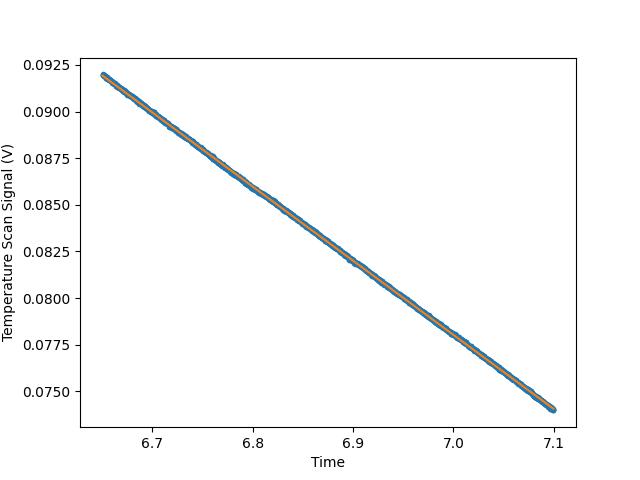
Fixed issue with terrible calibration: the temperature scan signal was weirdly noisy (see CorrectedTempscan.jpg), so I did a linear fit to smooth it over and used these values to perform calibration. This led to updated calibration values for the slope of the linear region: Probe: Slope (V/nm): -1.659, Slope (V/THz): 3.415 | Probe with pump: Slope (V/nm): -13.004, Slope (V/THz): 26.2367
Attached are the fixed calibration graphs: err_signal_with_pump.pdf, err_signal_without_pump.pdf. The updated noise spectra with these slopes is found here: NoiseSpectra.pdf.