Displaying reports 501-520 of 1091.Go to page Start 22 23 24 25 26 27 28 29 30 End
Reports until 10:21, Thursday 08 August 2024
How To General
Briana Chen - posted 10:21, Thursday 08 August 2024 - last comment - 14:30, Friday 09 August 2024(11810)
Get FFT/PSD of a probe point

Previously, Torrey had to divide out the controller from the control signal to get the error signal. You can avoid all that if you just use the built-in math channel on the laser lock box and set it to take an FFT at a probe point. 

Comments related to this report
Torrey Cullen - 10:23, Thursday 08 August 2024 (11812)

:)

Briana Chen - 14:30, Friday 09 August 2024 (11816)

Even though this is nice, I should mention that this FFT will differ from the spectrum analyzer because it is not windowed (will get more harmonics as a result), has a fixed bandwidth resolution depending on the time span. For these reasons, it may be better to still use spectrum analyzer on the Moku.

Atoms General
Briana Chen - posted 21:49, Wednesday 07 August 2024 (11802)
Noise spectrum attempt with increasing integrating unity gain frequency

To collect data from three channels, you can use the triggered data logging. Go to the data logger and set Start -> Triggered then click record. It won't start recording until the trigger hits. I set the trigger to come from the temperature scan signal reaching a certain voltage amount (1 mV). This trigger is the same for both data loggers and then you can enable the temperature scan on the laser lock box to start data collection (once it reaches 1 mV). The two data loggers take up two slots on the multi-instrument mode which is not ideal since we may need more ports for other purposes, but this process works for getting data from >2 channels. The trigger channel needs to be an input channel, it cannot be the external trigger channel. See configuration here: multipledataloggers.png. For now, the Moku Go has been put back on the previously electronics table since we don't need it anymore. 

Retook data (error signal, PSDs) just for a clean slate and also with the above settings since we don't have to shift anything anymore. Because we are using the slow controller, we don't have the issue that Torrey had with having to divide out the effect of the controller from the control signal to get error signal. We can just output it directly from the fast controller track (setting the gain to 0 dB so it essentially doesn't do anything).  The measured error signal today is found here: error_signal.png. The magnitudes of the slopes are (V/nm): ~2.40, (V/Hz) ~4.89e-12. 

At low unity gain frequency, there is overlap: low_unity_freq_psd_comparison.png. As a note, there is a peak at 60 Hz, which I would guess is AC line noise. I was able to get the integrator unity gain frequency to 48.83 kHz (with integrator saturation level of +1.0 dB). The way I am verifying that the controller actually is controlling is ensuring that when I close the switch for control, the photodetector signal does not decrease (moving towards the absorption dip minimum) and the error signal increases. This was the case for when I had the 48.83 kHz integrator unity gain frequency, this picture shows when I broke and reconnected the controller: seemslocked.png. At this higher frequency, we would expect the reduction in noise when locked to be lower. This is unfortunately not the case, the two noise spectra essentially overlap: higher_unity_freq_psd_comparison.png. If we plot the difference between the locked/unlocked PSD (really it is an amplitude spectral density based on the units, PSD would be that squared), there is not a significant difference: Difference.png. The reason for different "levels" of spikness in different section of this graph is becauseI took measurements of the power spectra into three sections: 0Hz to 1 kHz, 1 kHz to 100 kHz. 100 kHz to 1 MHz to get sufficient resolution. The controller for hte higher frequency is shown here: controllerconfig.png.

I think the individual frequency spectra makes sense. I think we should not be using differentials (unlike what Torrey had done, see his log post 2/21/2024) because that was converting a bandwidth of some wavelength amount to that same width in frequency. When we convert from the wavelength to frequency axis, we are just converting a singular value of wavelength to frequency (no distances). The order of magnitude should be around 10^6 Hz/sqrt(Hz), not what I originally thought should be 10^-6 Hz/sqrt(Hz). 

If we look at the spectrum of the error signal, it seems like the unlocked error signal has less noise than the locked one: spectrum_error_signal.png. I am not sure if this is extremely concerning because this just shows the amount of noise in the error signal. But wouldn't we care more about the noise in the actual signal (photodetector?), which tells us more about how our plant? I am not sure if this argument makes sense since the error signal is really just a low-pass filtered version of the photodetector signal. 


As far as I know, there are 3 ways to produce the noise spectrum: 1). Use the Moku built-in spectrum analyzer, 2). Use the built-in math channel on the laser lock box and set it to take an FFT, 3). Take a timeseries of the photodetector/error signal and then do an FFT in post processing. The three differ in units and potentially in windowing aka ensuring the ends of the measured signal go to zero at the ends (this would be mainly be the case with the spectrum analyzer). I have not been successful in getting all three to agree yet. 

Anyways, the main issue is that the there is no distinction between the noise level of the locked/unlocked spectra seem to overlap, even at higher unity gain bandwidths. Some thoughts:

On the bright side we should be able to lock at higher frequencies than before. Couldn't get the fast controller to lock, will try tomorrow.

Images attached to this report
GQuEST Output Filter Cavities
Torrey Cullen - posted 16:44, Wednesday 07 August 2024 - last comment - 10:28, Thursday 08 August 2024(11809)
OFC2 Power Budget

- Performing 1550 finesse ringdown measurements first. The frequency that matches the two wavelengths has changed. The new frequency that matches them is 232.57 MHz. This is a significant drift in a 24 hour time frame.

-See attached finesse measurements. 1550ringdown.png On one trial (I took more but haven't calculated from them yet) the 1550 finesse is 2486. This is consistant with the previous cavity measurements in transmission.


On to the power budget:

-1550nm input: 12.85 mW

-1550nm REFL: 5.9 mW - This measurement is a little tricky. The has a large dependence on how well the AOM frequency is tuned. I held the power meter in the REFL spot and had brianna scan around on the aom frequency to minimize the amount read on the power meter. 

-1550nm TRANS: 2.17 mW - Again, this requires placing the power meter and tuning the frequency to maximize the transmission value.

I don't think 1 - (5.9+2.17) / 12.85 = 37%  worth of loss in this cavity.


-775nm input: 76 uW - note the room lights emit a fair amount of 775 light so this is done in the dark.

-775nm REFL: 75 uW make it to the REFL PD - since I can't measure the REFL power while the cavity is locked 11C98CCB-B9ED-4A2E-BF63-3207EF7A87AF.png shows the voltage value on the PD while locked. The max value is roughly 95 mV. This means nearly all the light is cancelling - (2.6 mV (dark voltage) + .8 mV )/ (2.6 mV (dark voltage) + 95 mV ) = 3% the original value. Therefore I'm inferring a power reading of 2.5 uW in reflection.

-775nm TRANS: 22 uW - after a BSW29 (50:50)

I don't think (22*2+2.5)/76 = 38% is the correct loss value. 


Update Below:

I went to retry the 775 nm power measurement. I found some very high frequency oscillations in the trans signal due to the controller UGF being too high. Almost a pure sign wave. Because of this the average power the power meter is measuring is way off. This is most likely the case for the 1550 light too, will retry this tomorrow. In the mean time the new measurements are:

Input and REFL - same

TRANS - transmitted on 50:50 BS - 30.7 uW

             - reflected on 50:50 BS - 36 uW

Total exiting the cavity: 66.7 uW (BSW29 on thorlabs quoted up to 1% loss or Tabs + Rabs > 99%, add 1% to this) -> 67.4 uW

This is much closer to the ringdown measurements. Tomorrow I may destroy the 775 TRANS alignment so i can measure without the BS there. And redo the 1550 measurements with this discovery in mind.


Images attached to this report
Comments related to this report
Torrey Cullen - 10:28, Thursday 08 August 2024 (11813)

Average of 3 data points to 1550 nm ringdown in transmission. Note that there is no REFL PD to compare to (no plans to put one in either, we don't ever need to lock the cavity with 1550 light). Average finesse between the three measurements is 2580 +/- 18. Again note these error bars are only calculated using the errors in the fit calculation, other factors should be included in final numbers.

Images attached to this comment
Atoms General
Briana Chen - posted 23:37, Tuesday 06 August 2024 (11807)
Initial Frequency Noise Spectrum Attempt

[Briana, Ian]

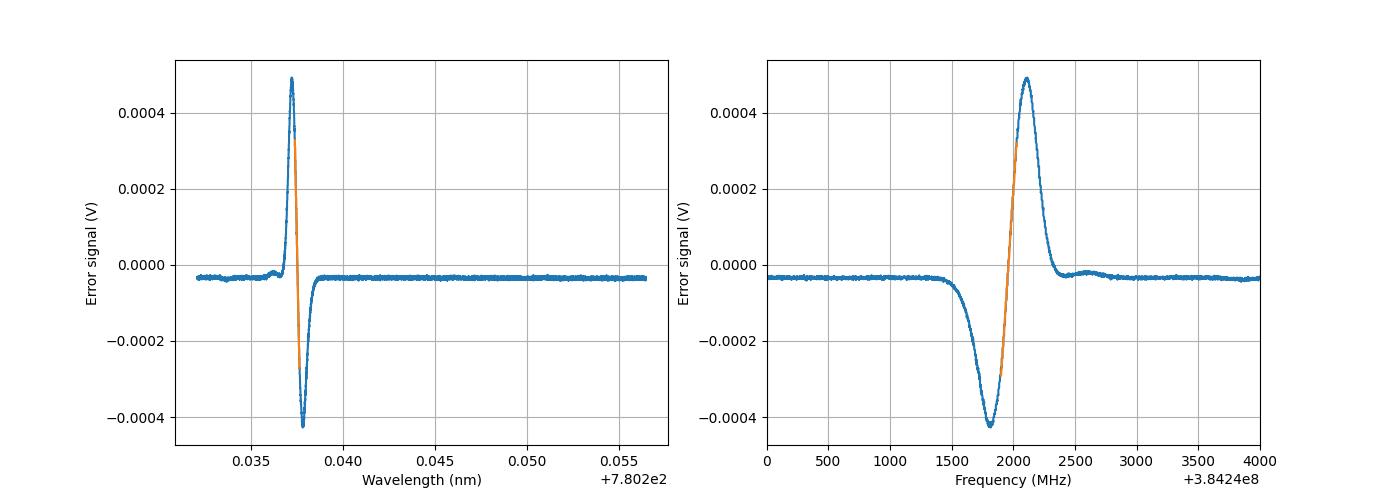
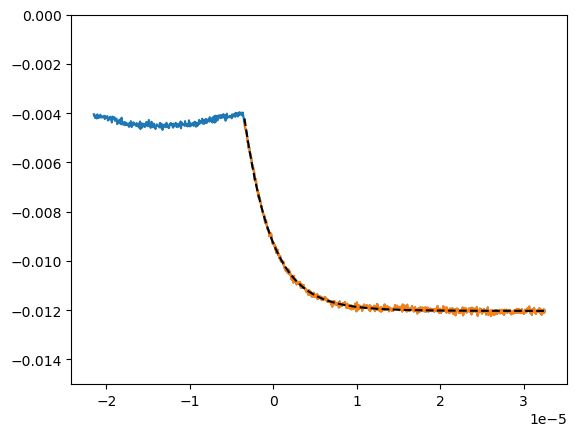
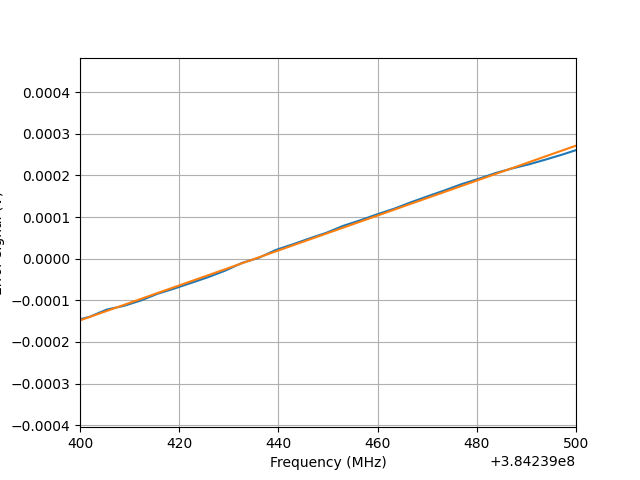
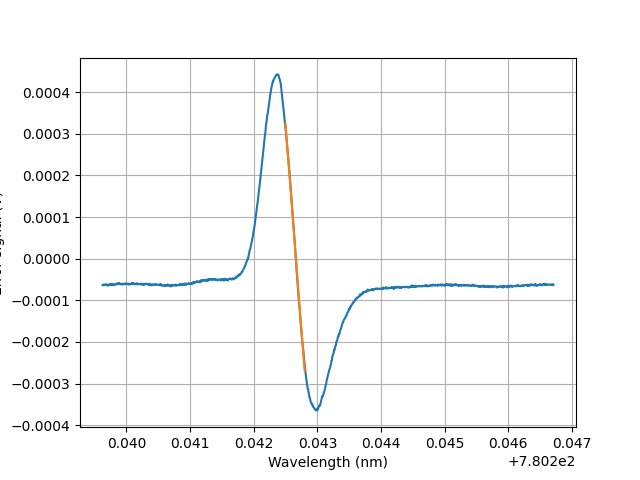
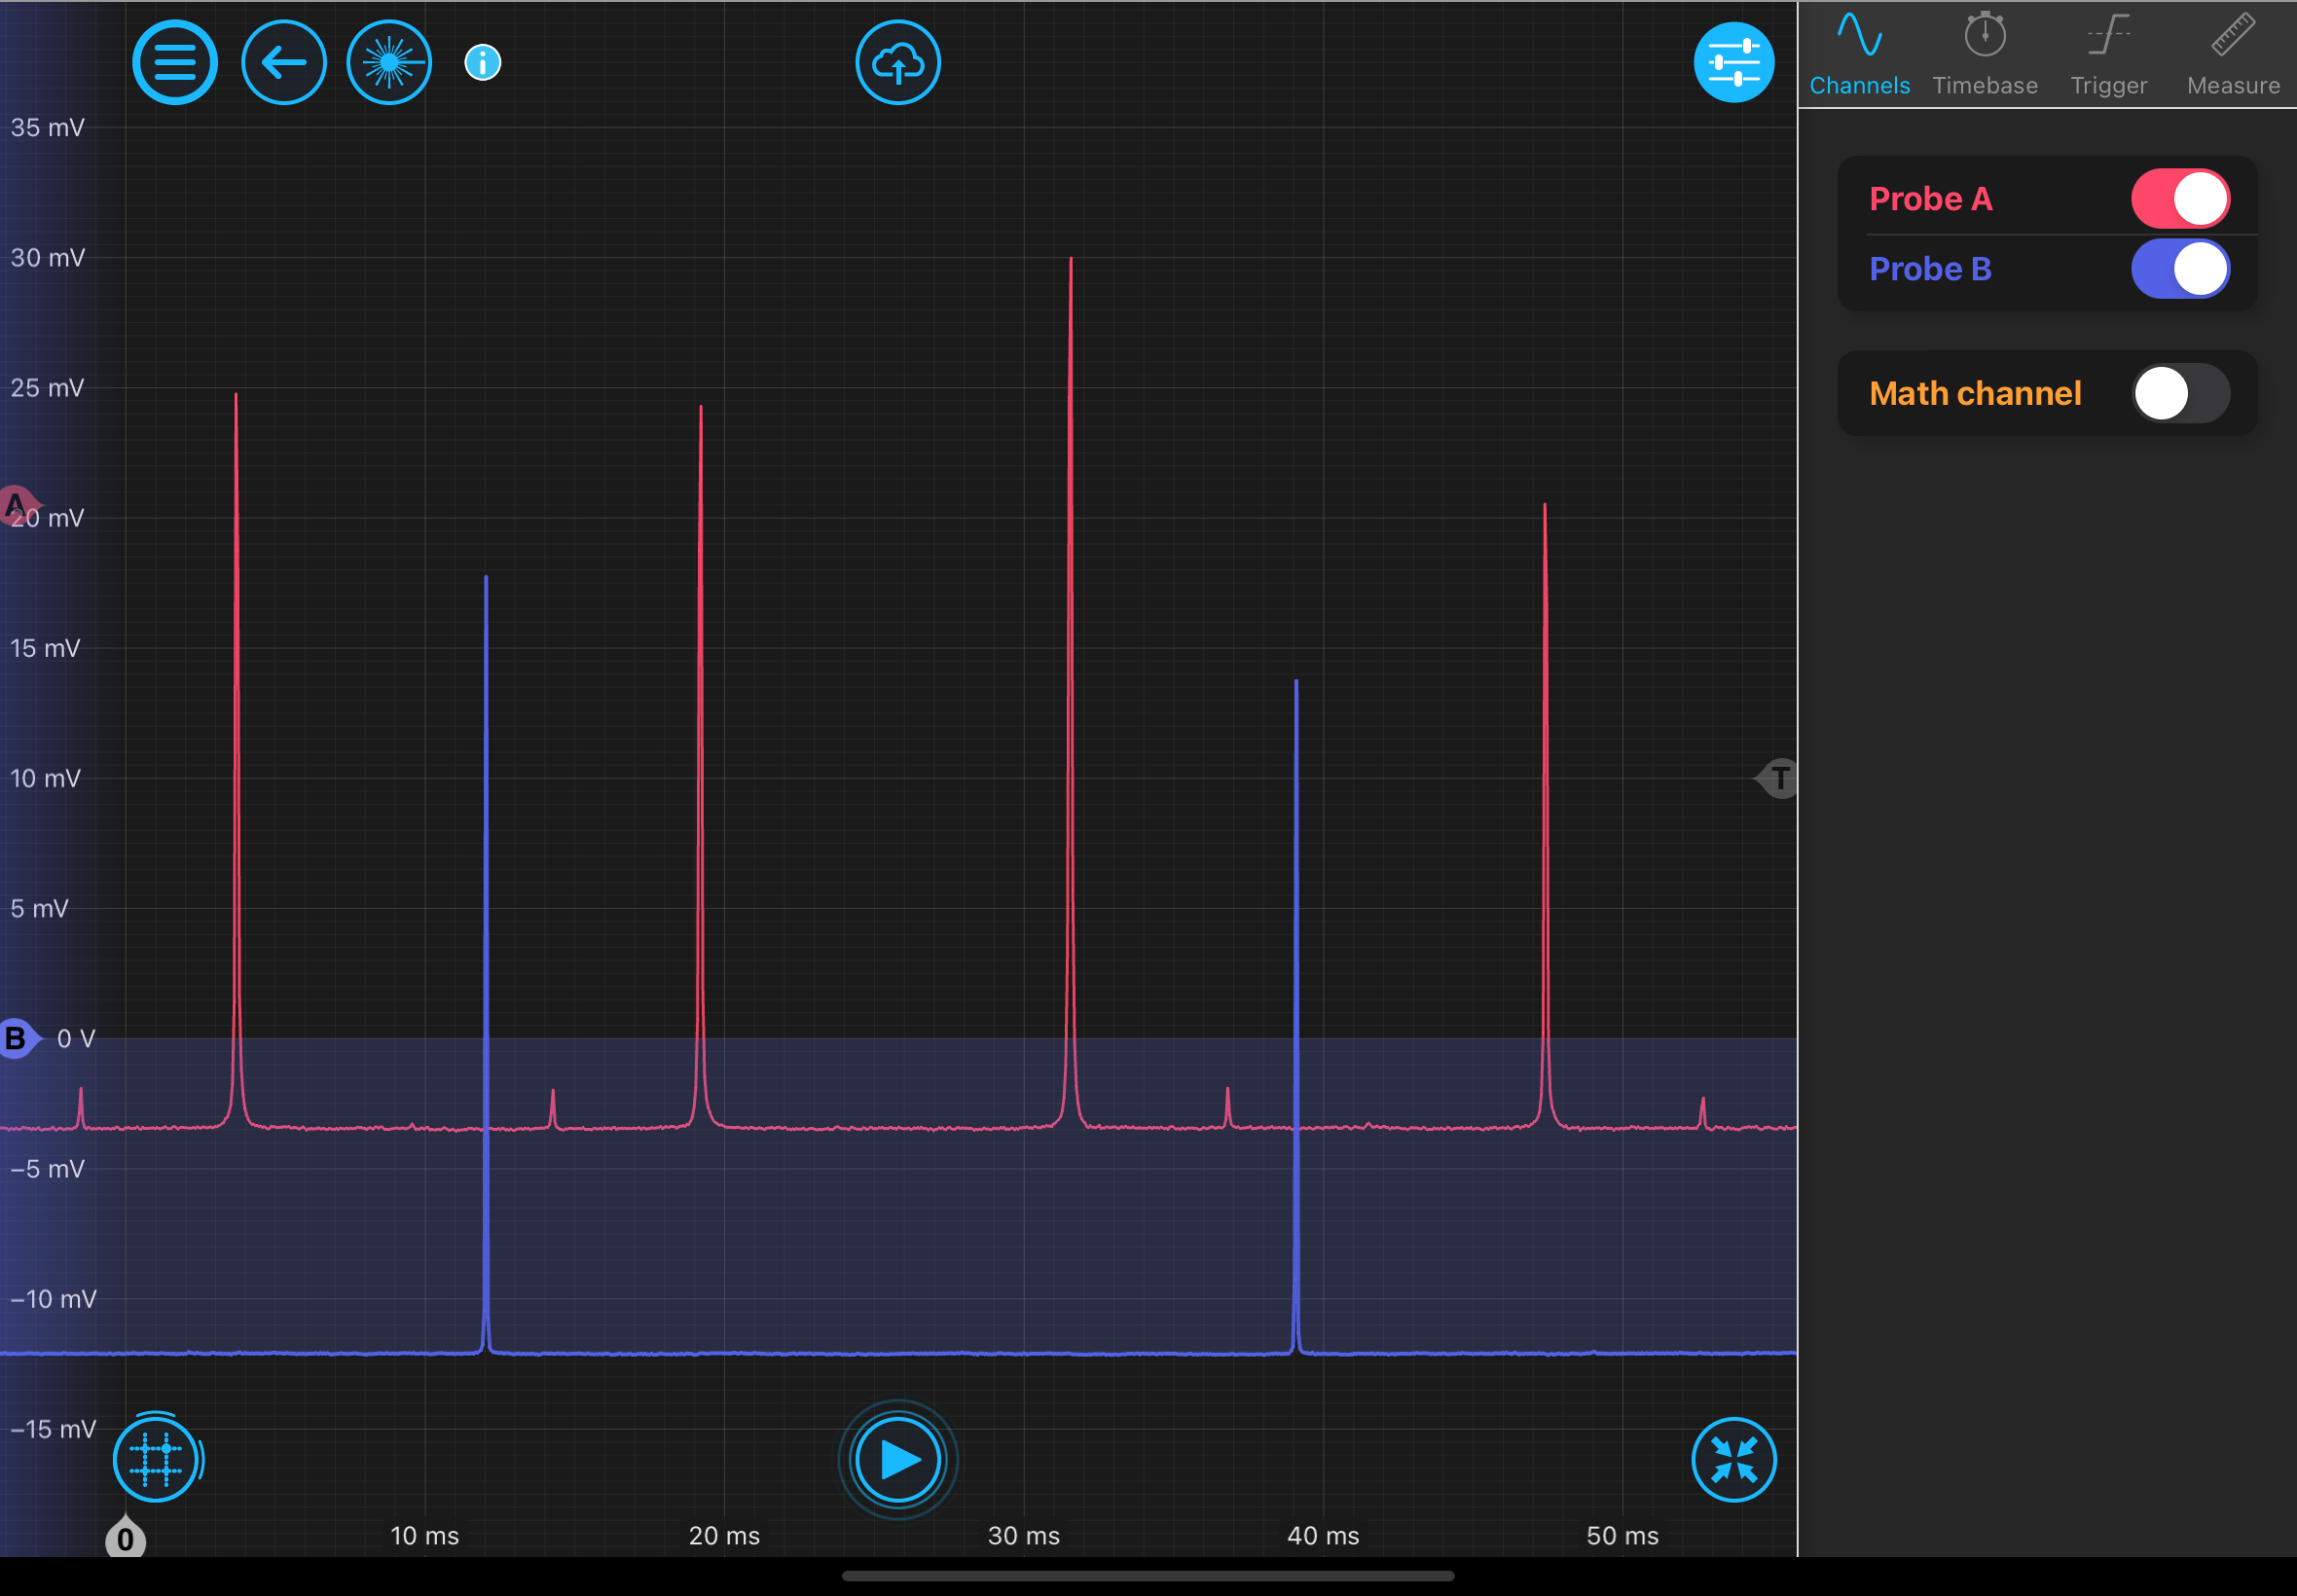
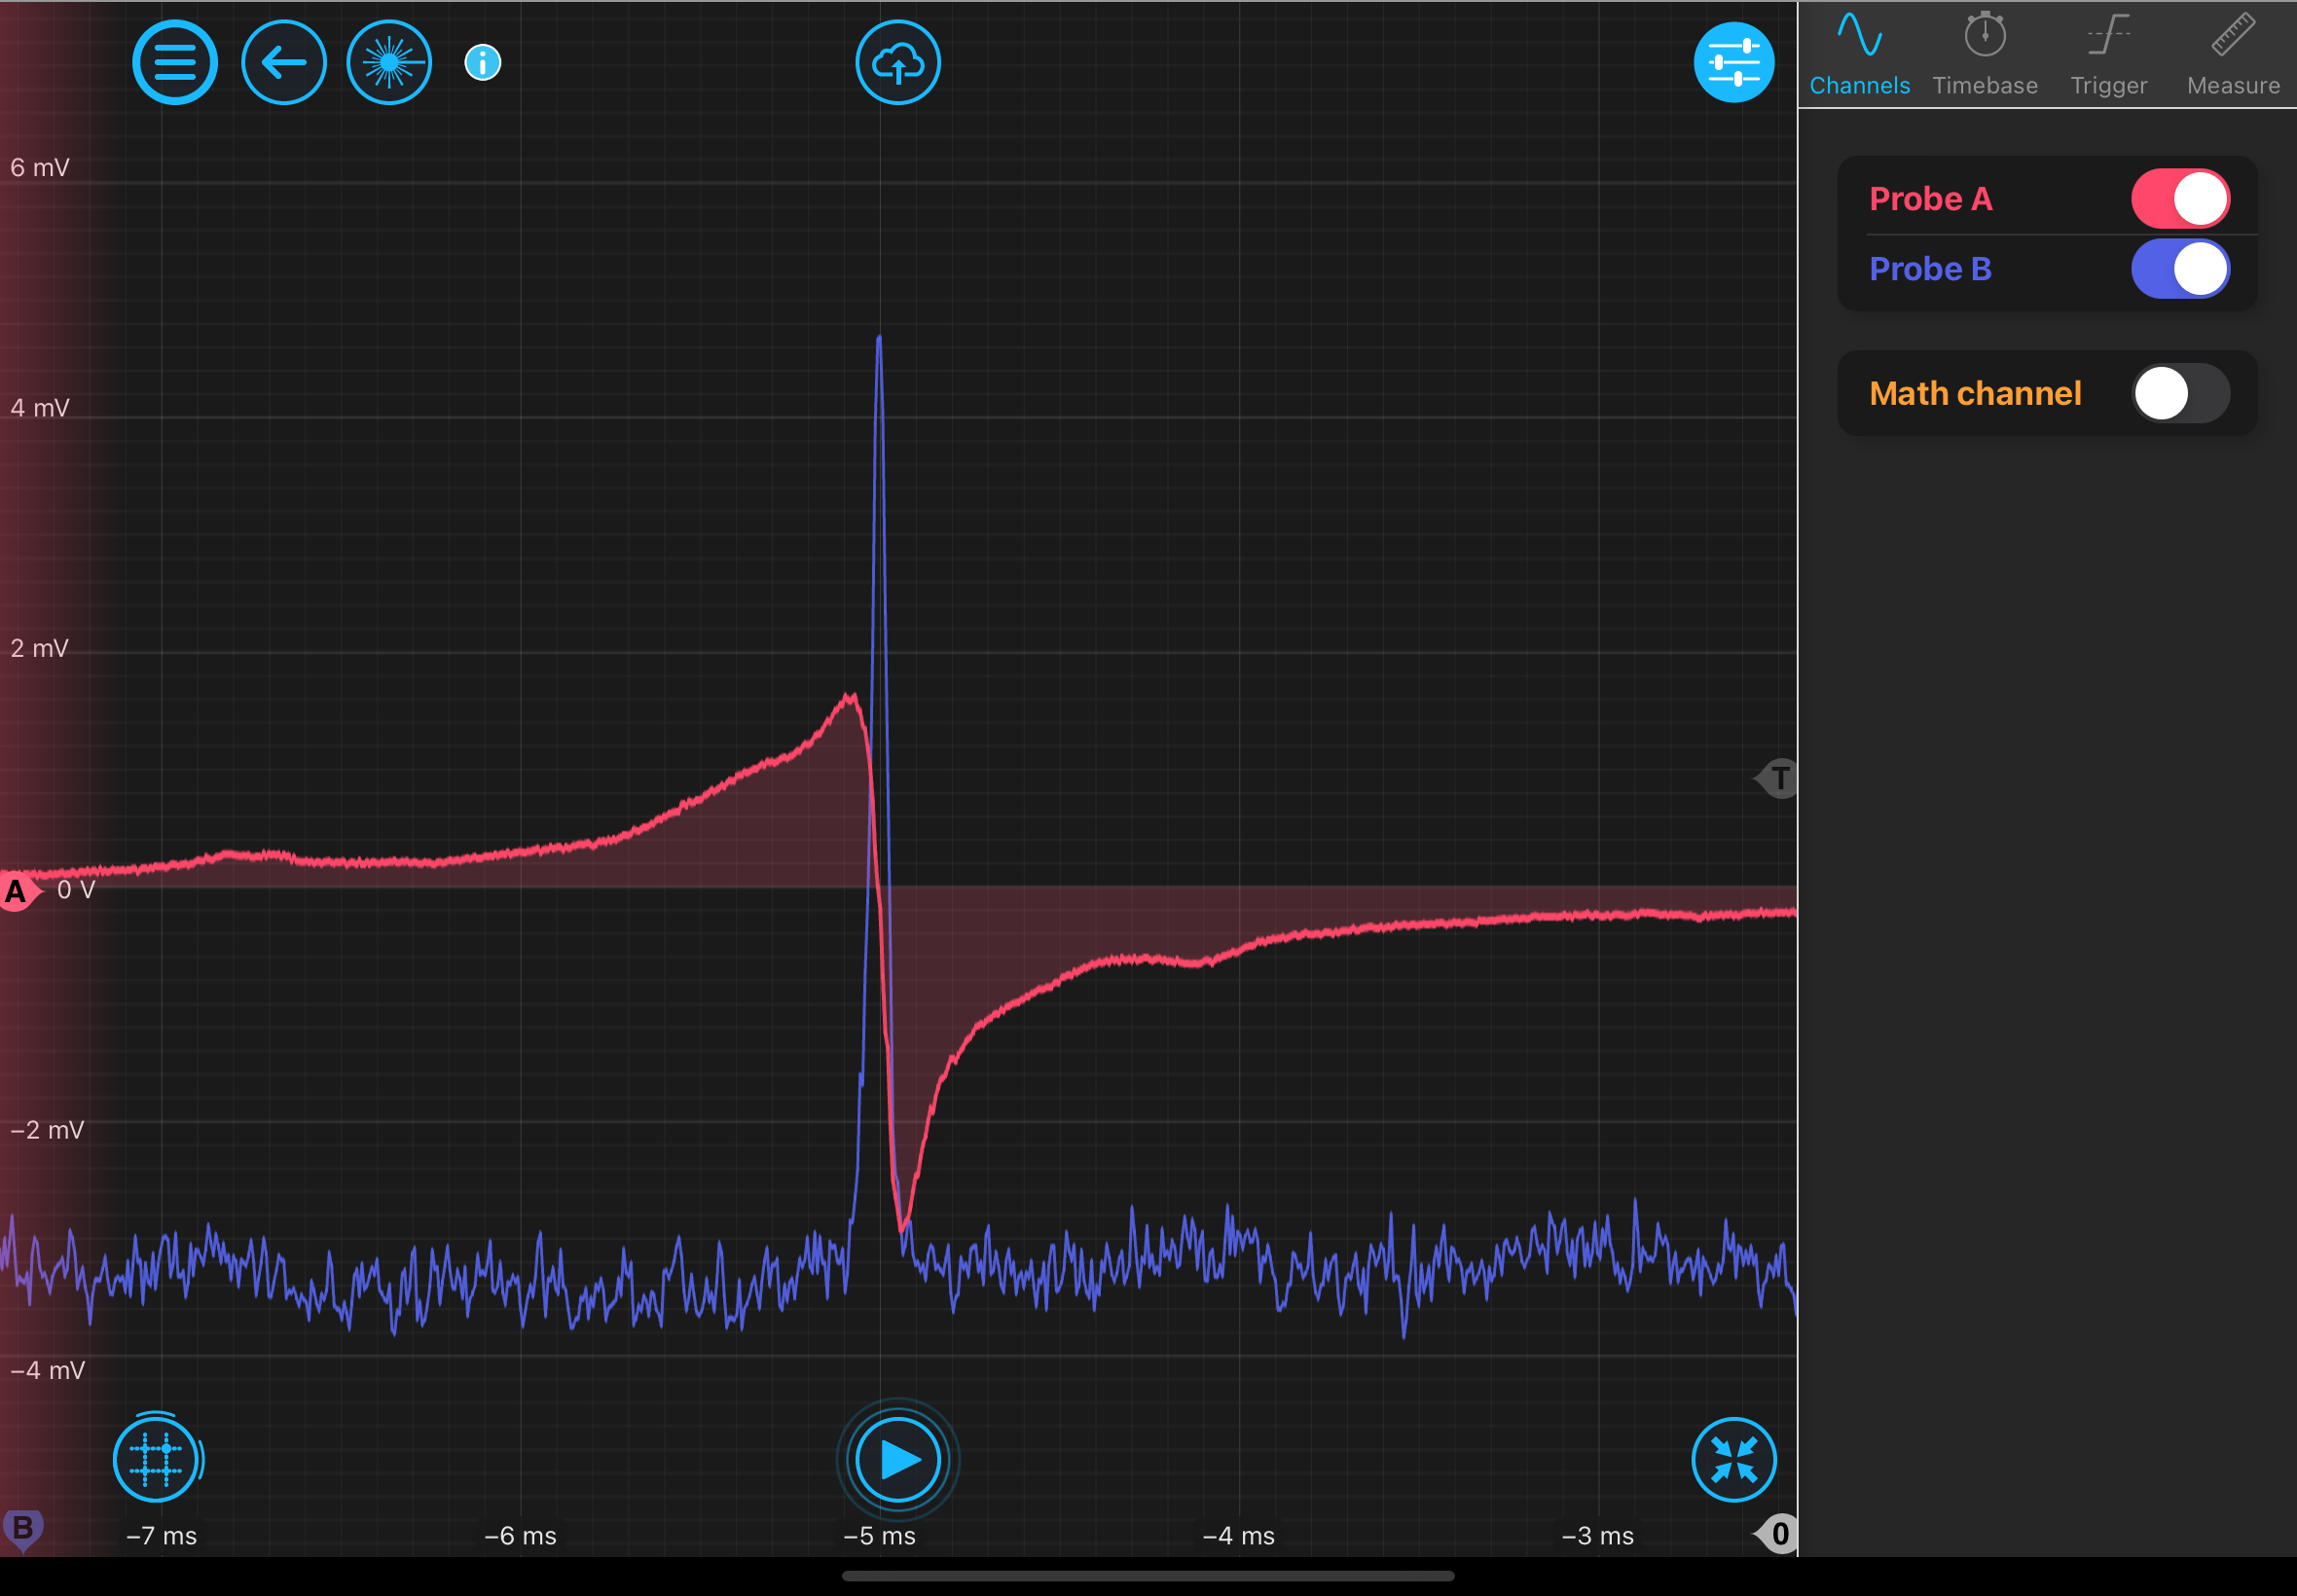
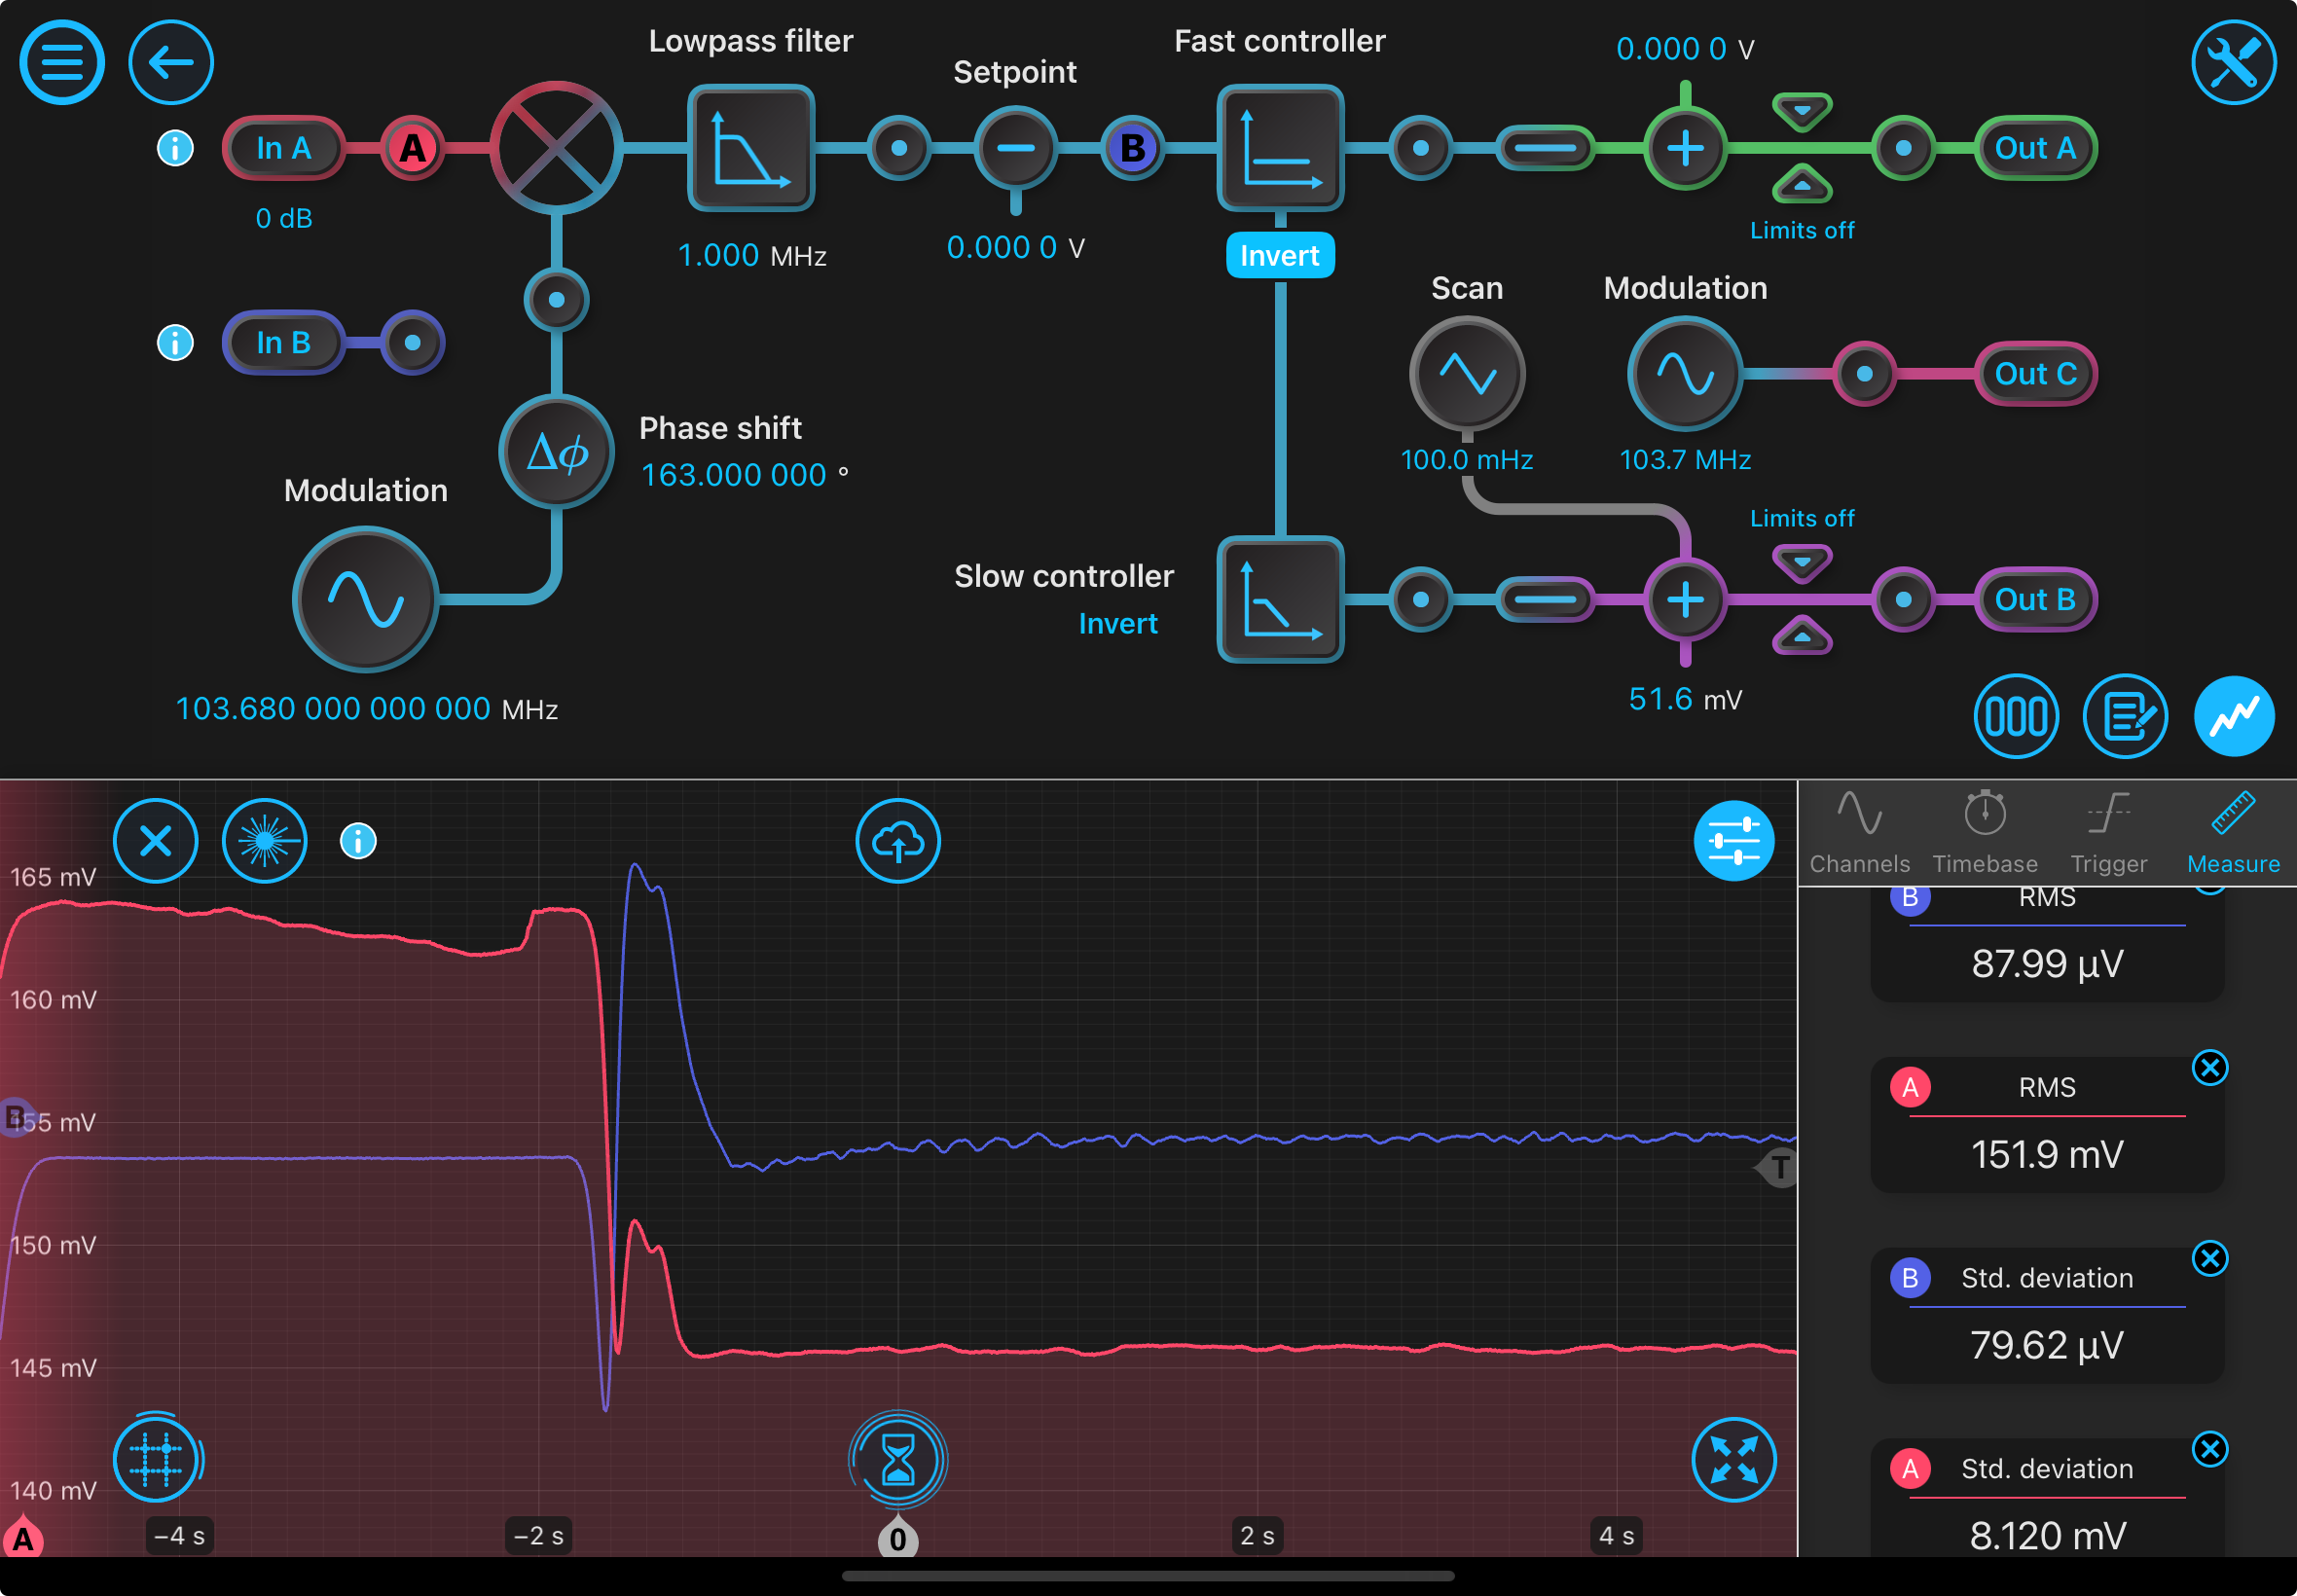
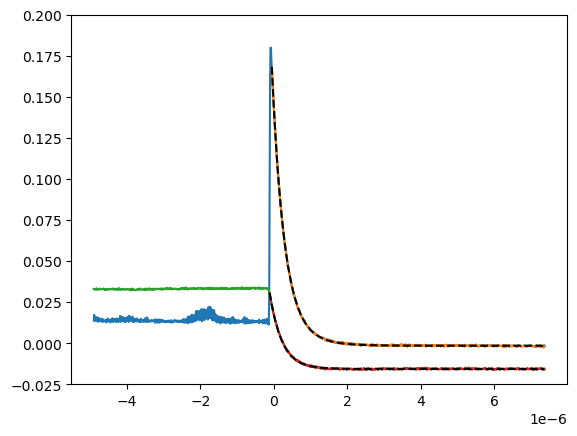
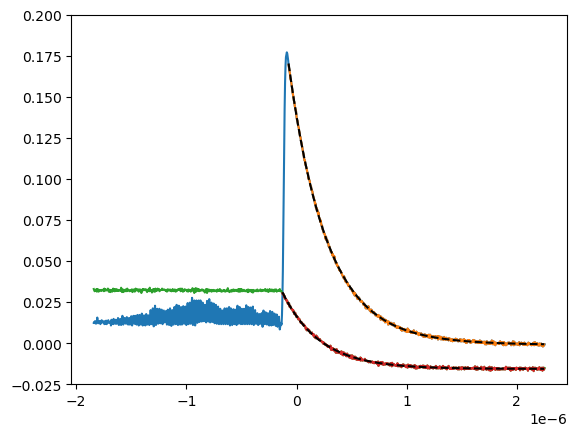
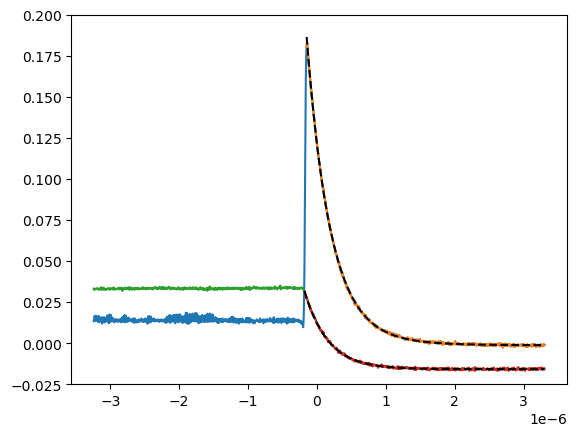
On 8/5, we took data of the error signal. It is not possible to export the exact error signal you lock to since lock assist mode doesn't have this feature. Because we need 3 channels to be exported, we attached the temperature and photodetector output to the Moku Go, took readings of the error signal and photodetector output with the Moku Pro, and shifted the two so they overlapped in time. Then, the temperature scan, photodetector signal, and error signal could match up reasonably well and we could calibrate the time axis to wavelength. The temperature scan signal is noisy so I fit a line to it when calibrating because the calibration becomes messed up from the noise. Once this is done, we take the linear portion of the error signal (shown in orange in the following plot: error_signal_wavelength.png) and determine the slope (since it passes through the zero point). For the wavelength x-axis error signal, the slope is -1.976 V/nm (makes sense with the error signal: if I get an error signal of 0.002 V, I am detuned ~0.001 nm from resonance). The same can be done when we convert wavelength to frequency, which should technically be easy (f = c/wavelength) except it causes problems in the noise spectrum as I will explain later: error_signal_frequency.png. For the frequency converted x-axis error signal, the slope is 4.19 e-12 V/Hz. This is all under the assumption that the error signal generally has the same shape/slope in the linear region across scans. 

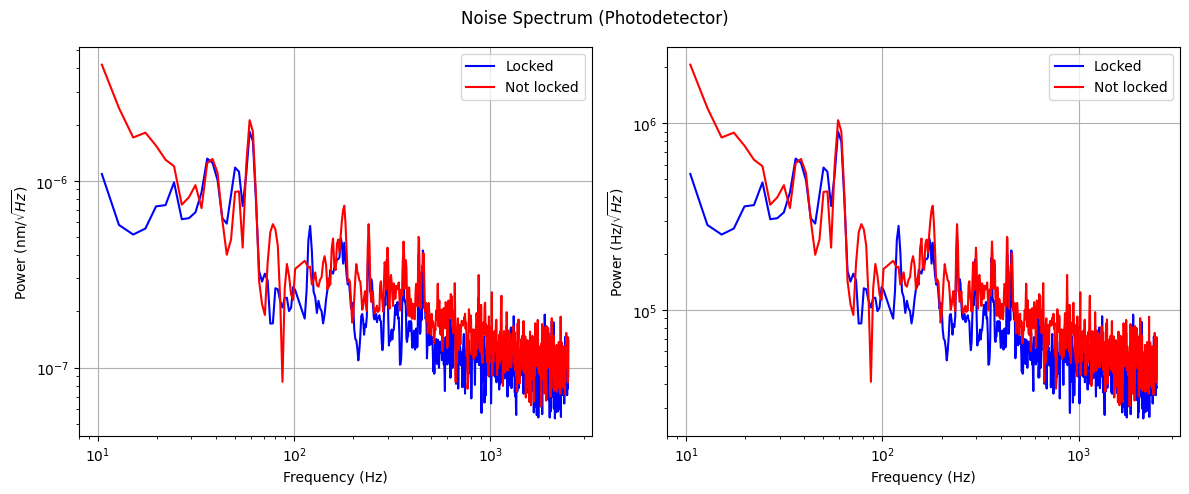
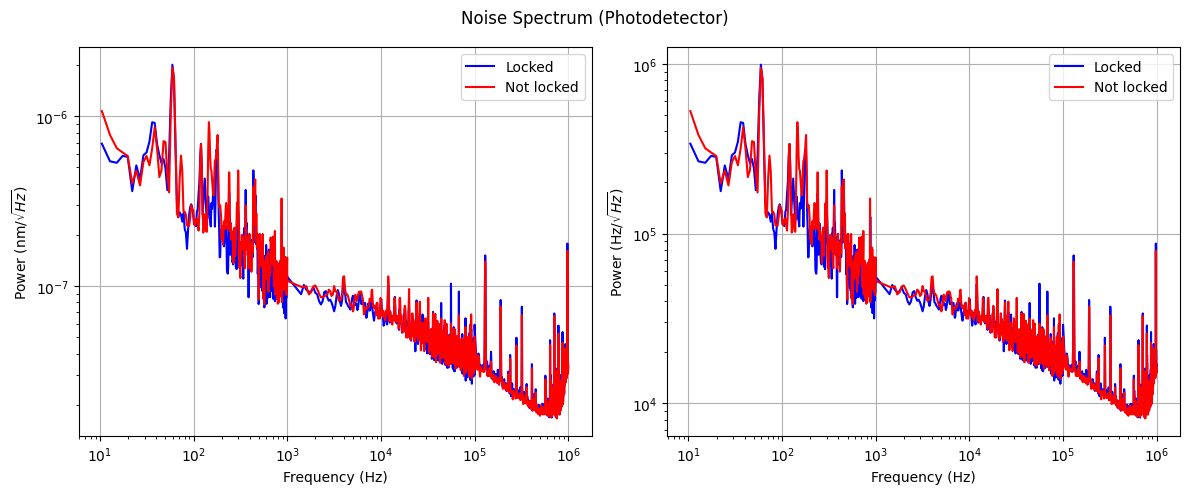
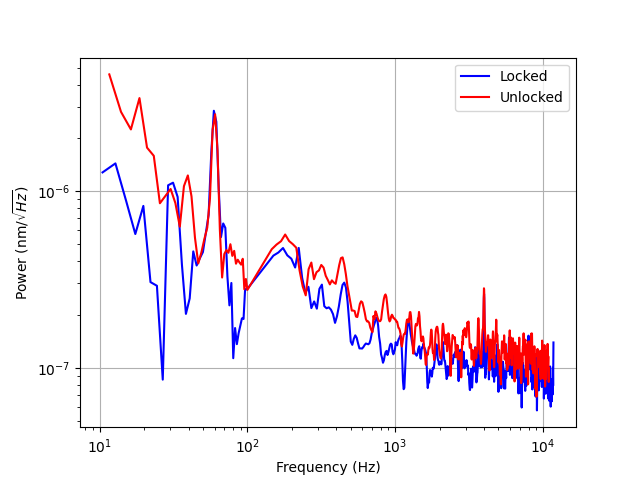
On 8/6, we took the power spectral density plots when the laser is locked and unlocked using the spectrum analyzer. The PSD was taken in two chunks with averaging over 6 samples because at lower frequencies (longer wavelengths), DC noise begins to broaden the spectrum (more room for error in the location of zero points of the wave during detection) so we had to zoom in from 0-100 Hz to get better resolution. Also, with the slow controller, we have a bandwidth of about 3 Hz (anything above will prevent the laser from locking, signal starts oscillating rapidly), which is not great. We took a PSD ranging from 0-10 kHz to cover the controller band. We want to increase the bandwidth (I frequency) of the slow controller so we can get a proper noise spectrum that is less cluttered by DC noise. 

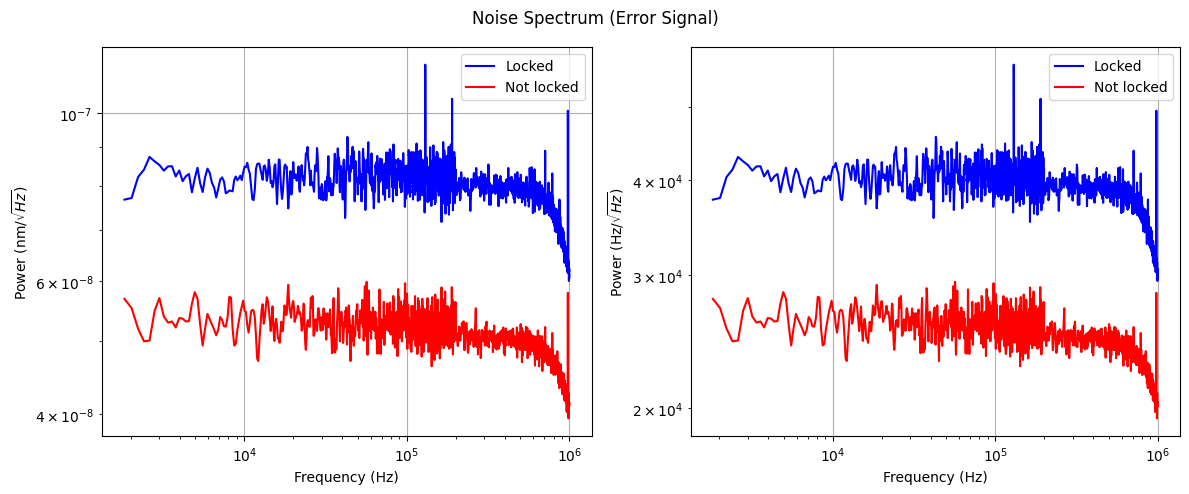
If we just look at these PSDs, we have no metric for how the different voltage ("power") readings correspond to frequency drifts (the y-axis aka power in V/sqrt(Hz) tells us the noise amplitude per frequency bin, but we don't have a good understanding of what this voltage means in terms of noise). So, we use the slope of our error signal to convert the voltage into frequency units (e.g. Hz/sqrt(Hz)), which gives us frequency noise (the linear region passes through the zero crossing point of resonance so we just need the slope as the "linear equation" in terms of detuning is slope * delta_wavelength, where delta_wavelength is the distance from resonance). We use the linear region because beyond the two "peaks," the controller will continuously push the laser frequency away from resonance (in the linear region the slope at the same error signal value would have the opposite derivative compared to the value outside of the peaks, so it pushes the frequency towards resonance instead of away). 

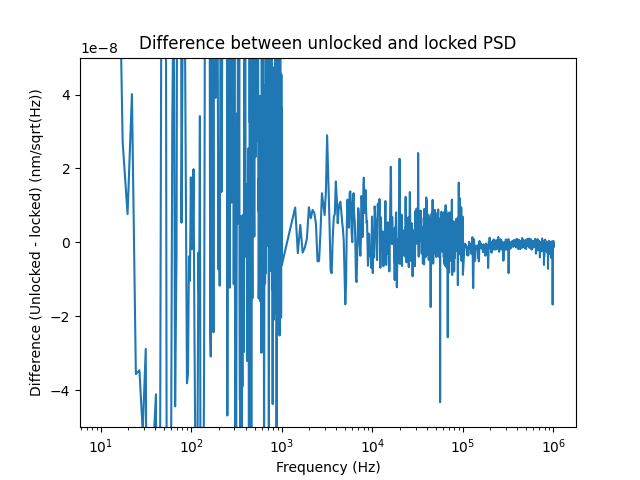
To convert this PSD spectrum to a frequency noise spectrum, we multiply the original power value (V/sqrt(Hz)) by the inverse of slope. The frequency noise spectrum with y-axis in nm/sqrt(Hz) is here: Noise_Spectrum_wavelength.png. There is some distinction between the locked and unlocked case at the lower frequencies but this could also be because of noise fluctuations. On the bright side, the locked case has kind of lower noise. We would benefit from moving to higher frequencies in the controller, I'm still not entirely sure how to do this. The noise spectrum with the power axis in Hz/sqrt(Hz) is here: Noise_Spectrum_frequency.png. The order of magnitude for the frequency spectrum is definitely wrong but I have been unable to find the error so far because the slope from the error signal along with the conversion from wavelength to frequency makes sense to me (getting 0.002 V from the error signal means the frequency is detuned from resonance by ~10^12 Hz, for reference the frequency at 780 nm is around 3.8*10^14 Hz). If anything, there may be a differential (df/dlambda) involved because we are dealing with power, but I don't see a reason why f = c/wavelength shouldn't work. Anyways, I would trust the noise spectrum using wavelength for now. As a note, we used the slopes of the 8/5 error signals to convert from V/sqrt(Hz) to nm/sqrt(Hz). In the future, it will be better to use the error signal from the same measurement time as PSDs. There is a lot of systematic error here but we currently want a rough order of magnitude noise spectrum that makes sense. 

One sanity check for the error signal is that we expect the unlocked scenario to drift more in frequency. When we look at the standard deviation of both error signals (unlocked and locked) using 8/5 data, convert the error signal voltage to a frequency away from the zero point, we get approximately 1.27 MHz for the locked case and 2.76 MHz for the unlocked case. This intuitively makes sense that the error signal would show that the laser has more deviation from the zero point (resonance) when not locked. 

When I refer to unlocked, it means that after we have locked the laser, we break the connection between the controller and temperature scan and let the system do its thing at the fixed temperature at which resonance occurs.

Other notes/things to check tomorrow:
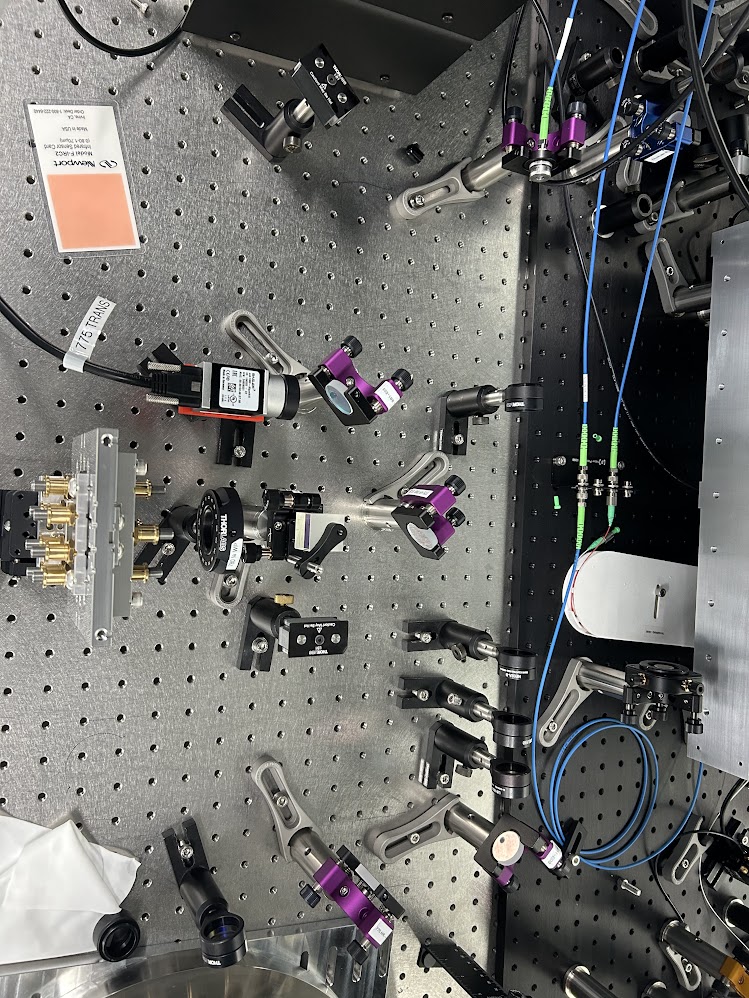
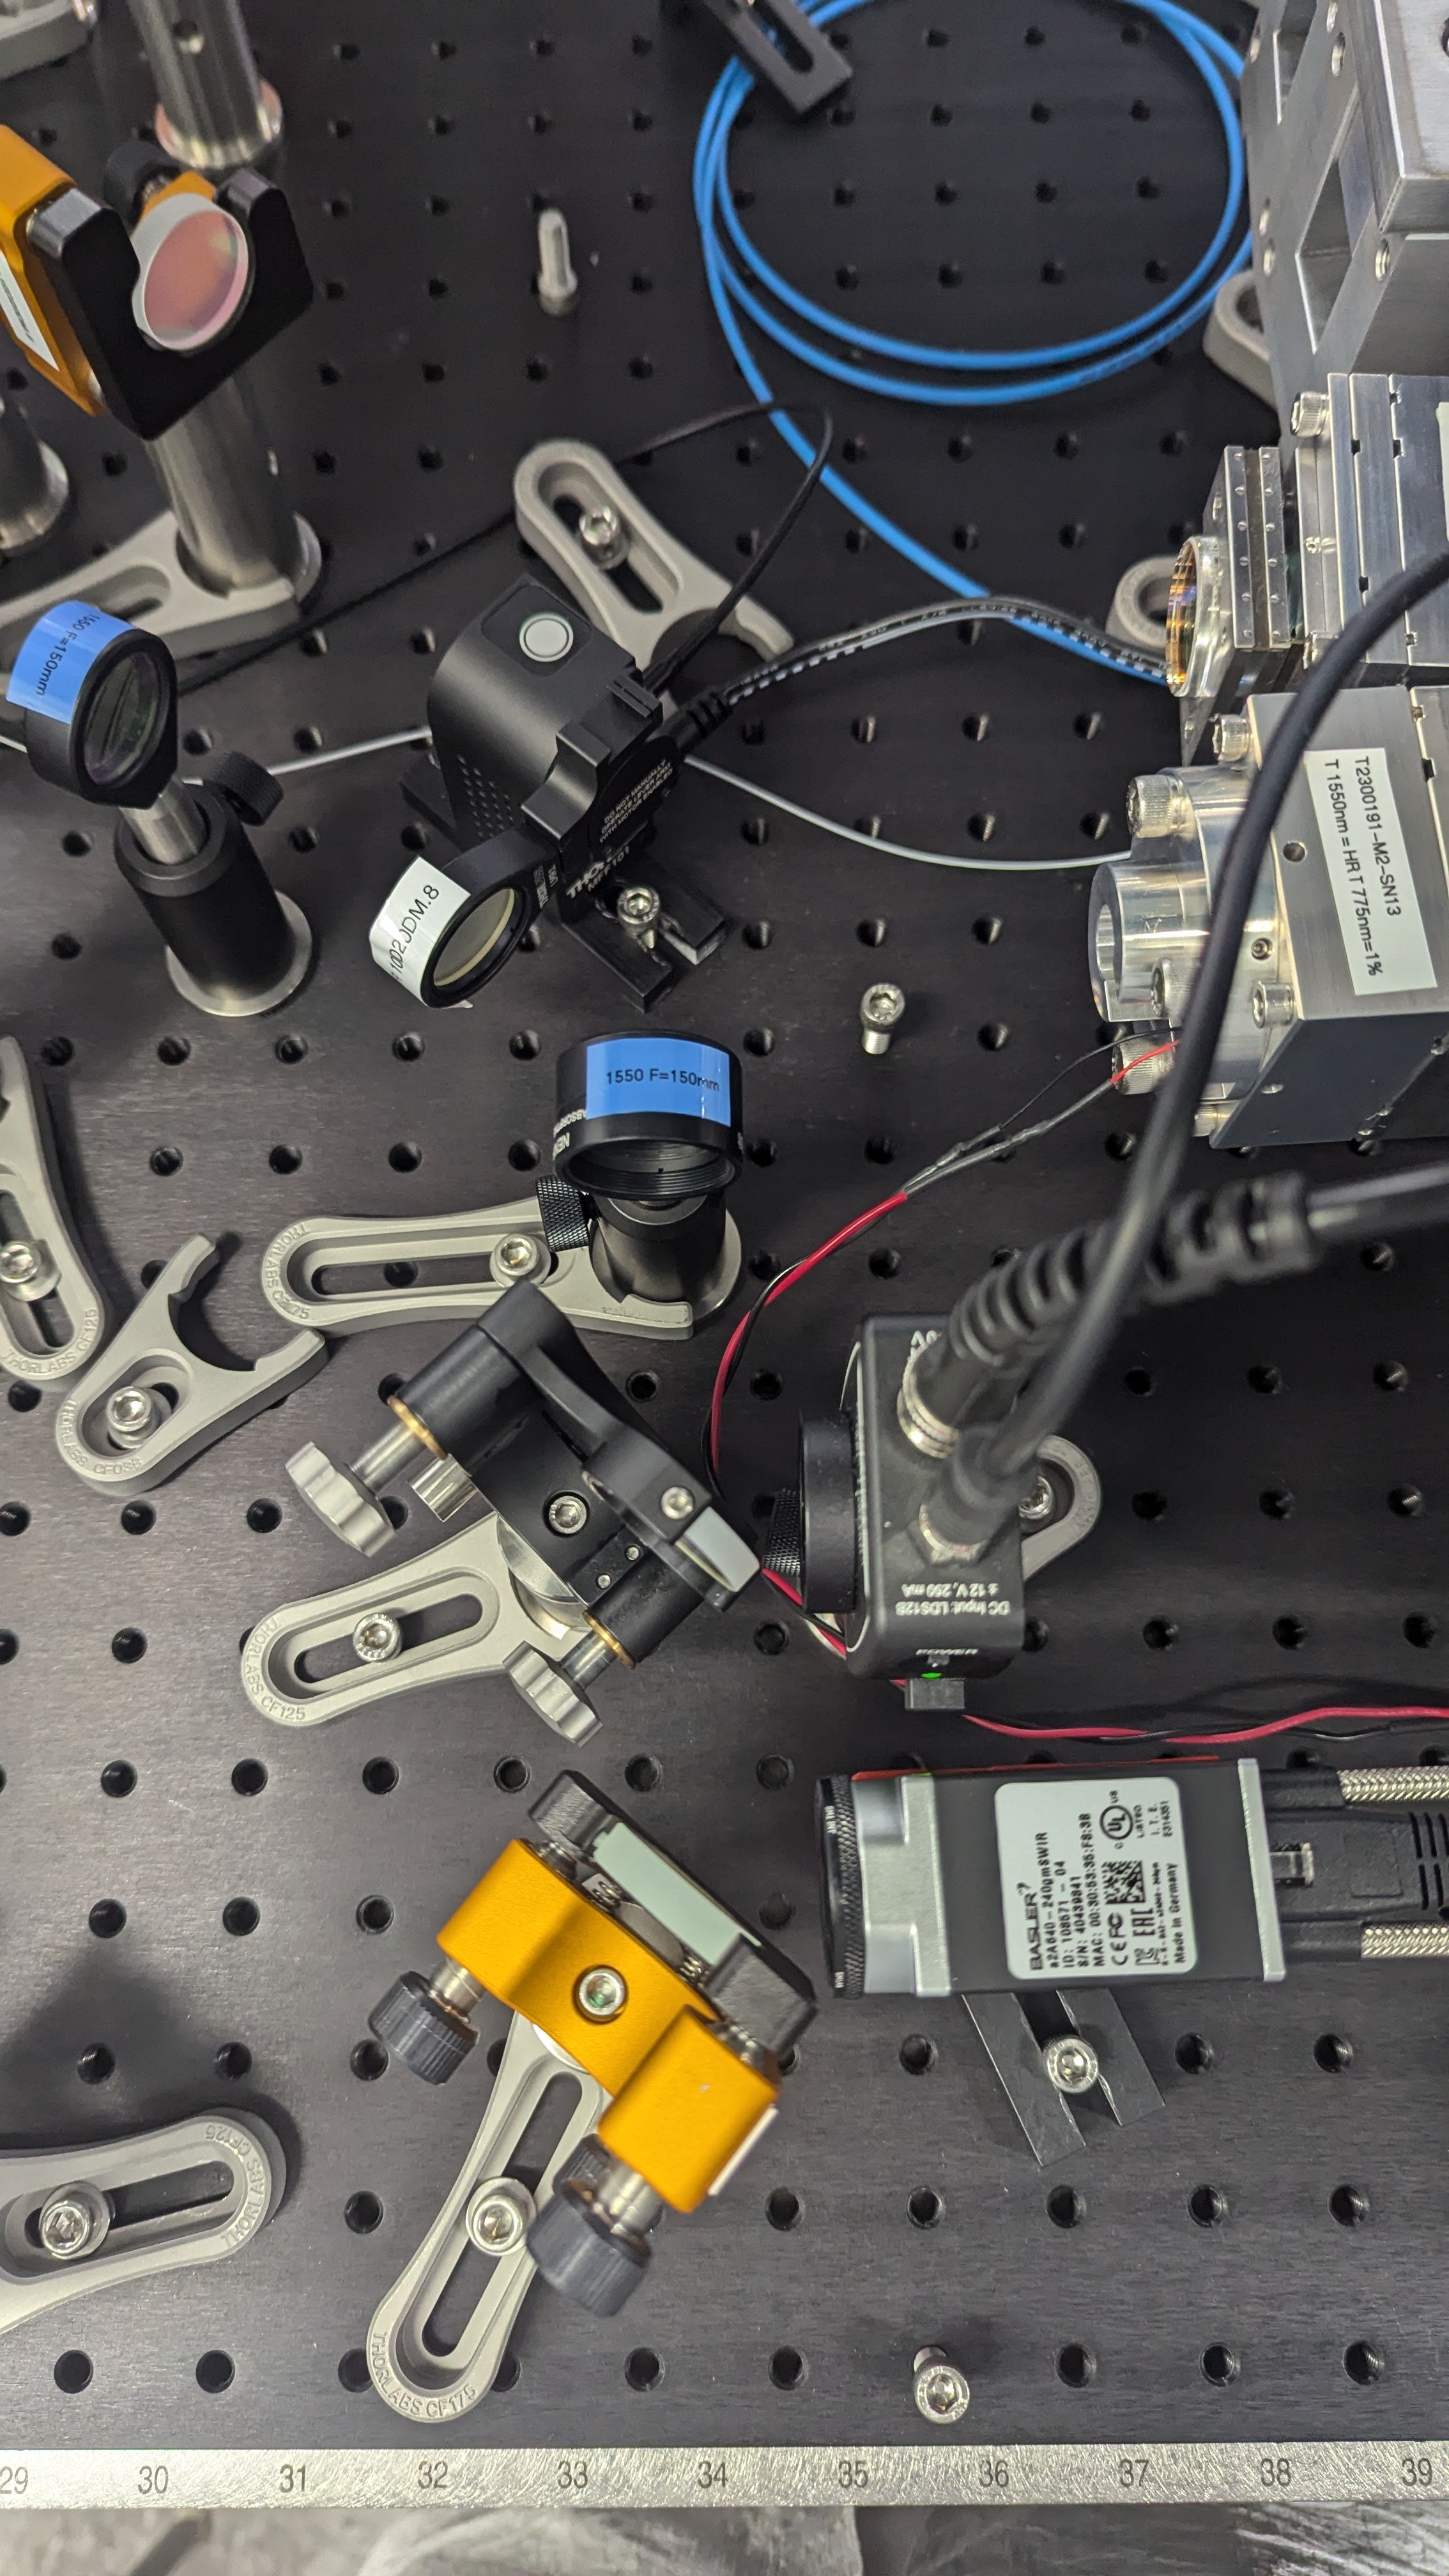
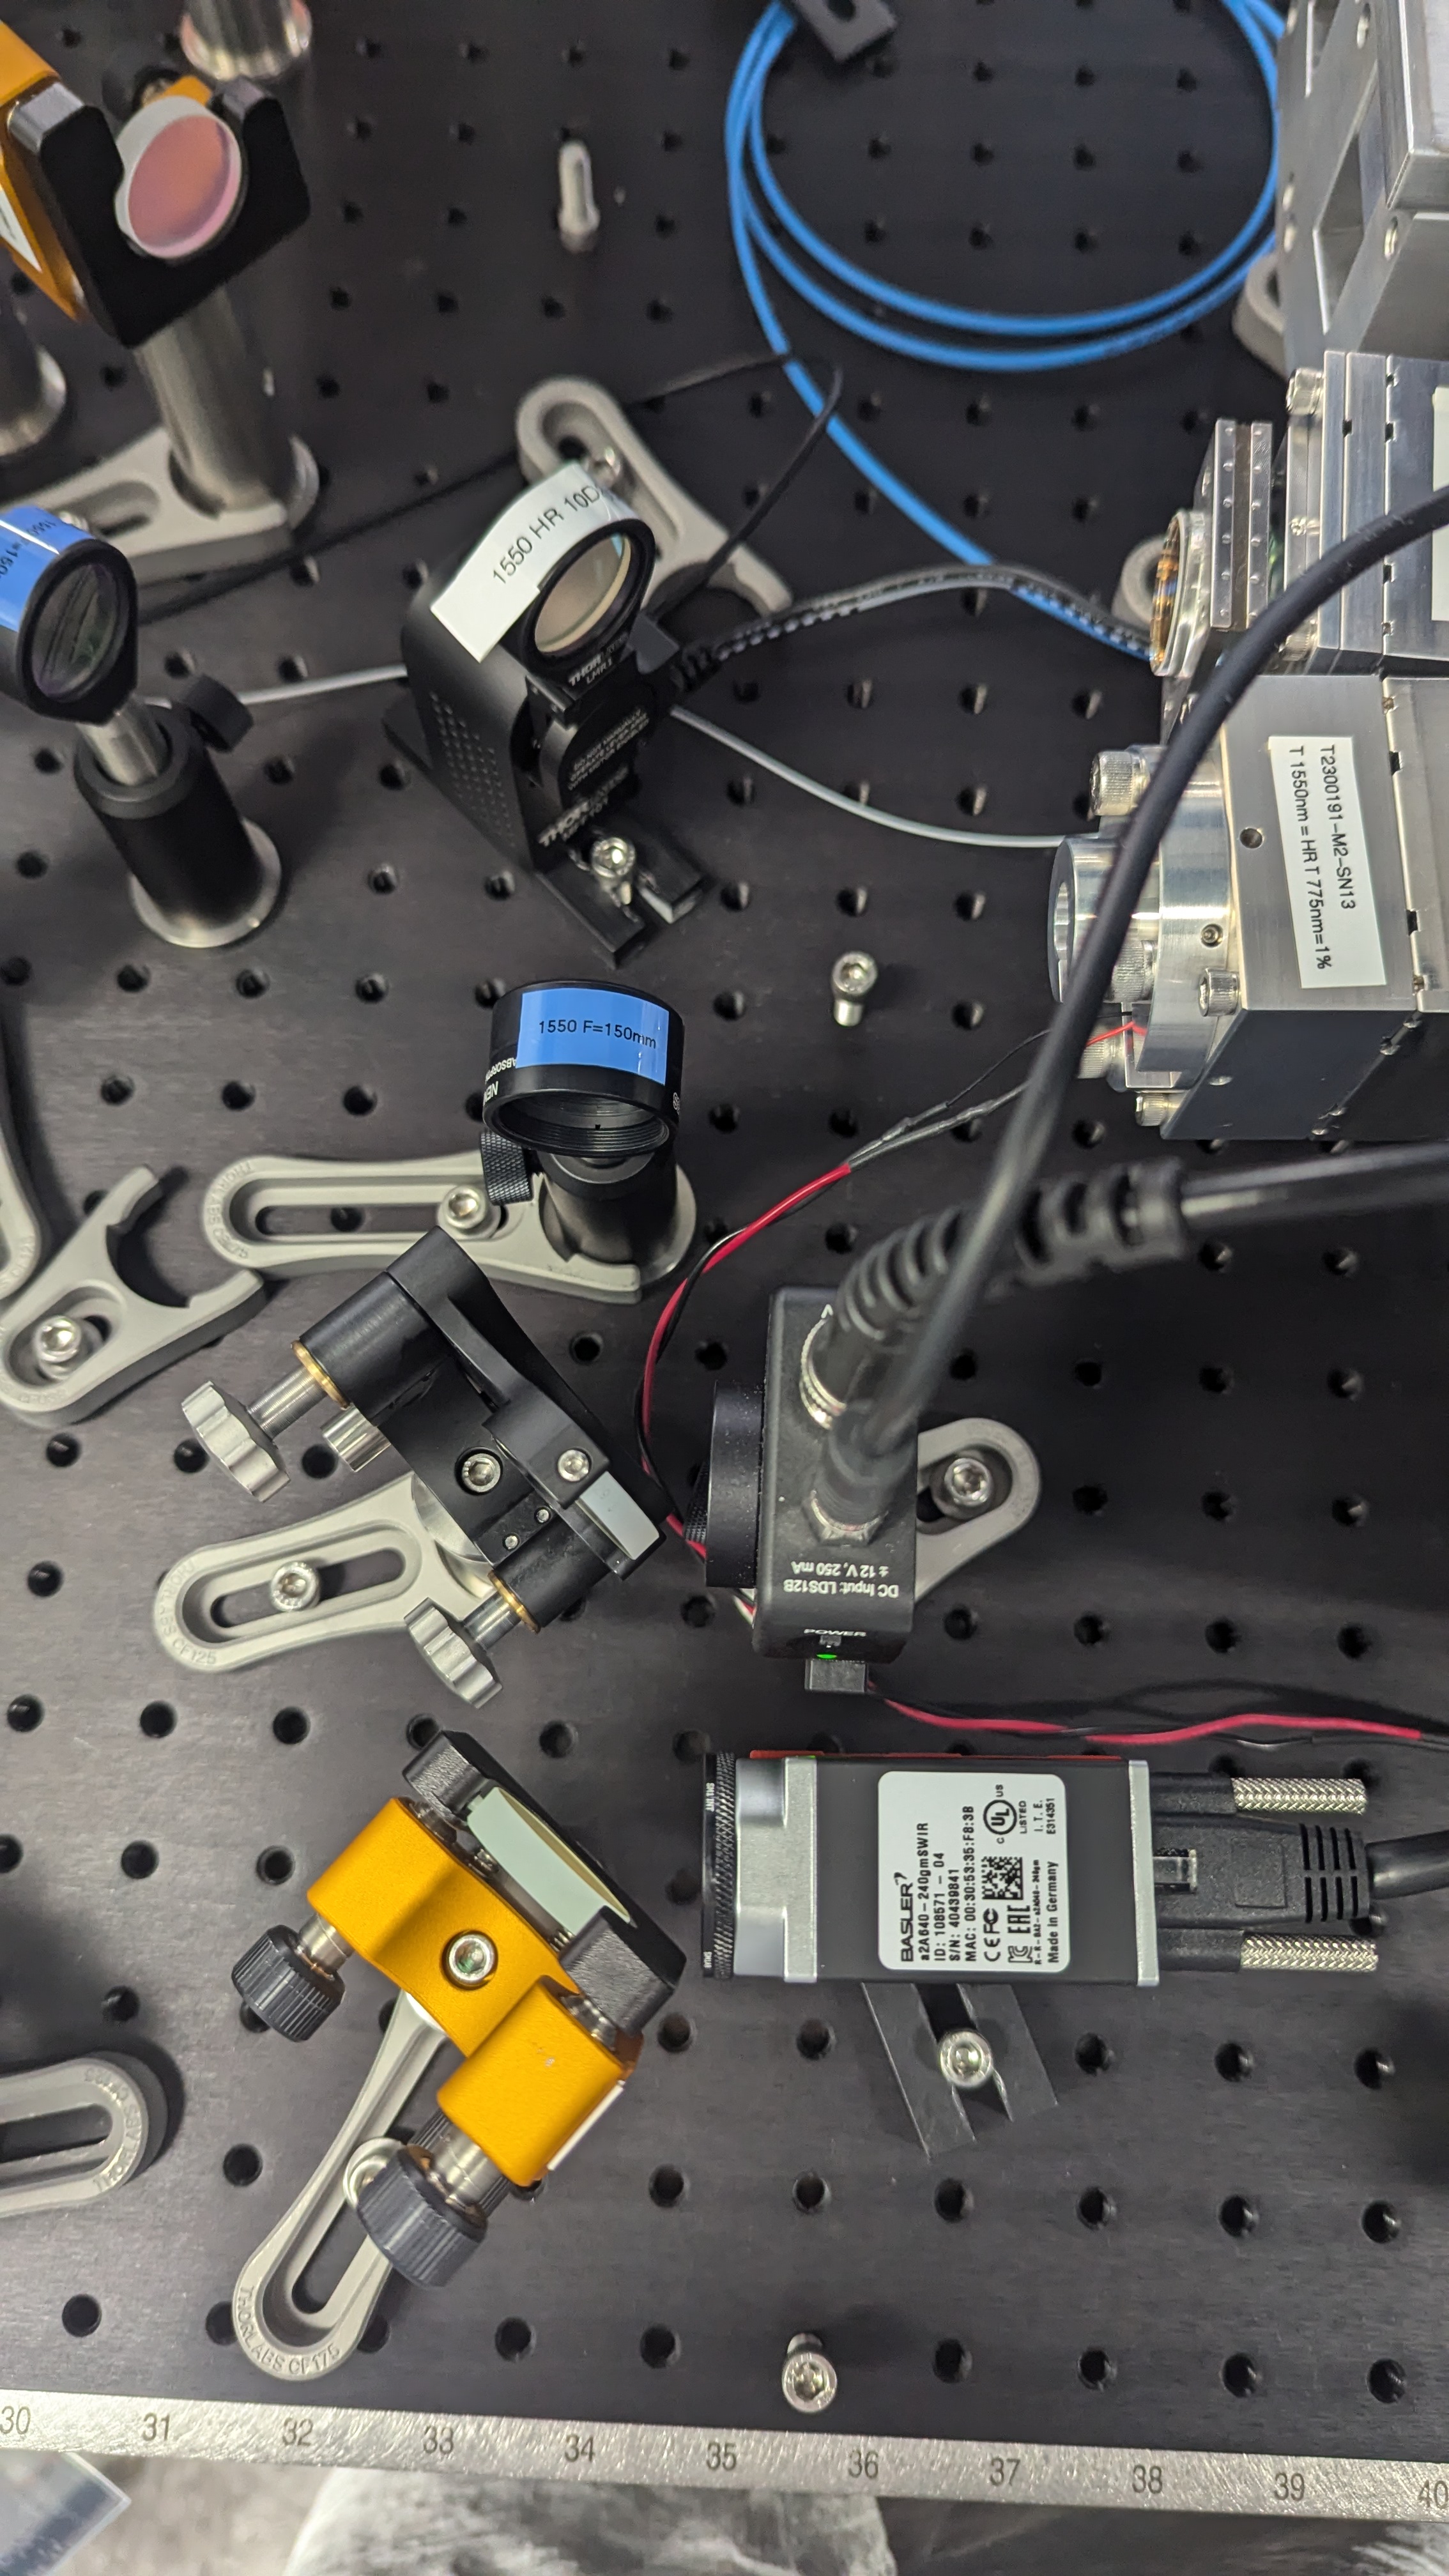
Images attached to this report
GQuEST Output Filter Cavities
Lab iPad - posted 15:44, Tuesday 06 August 2024 (11806)
OFC2 Update

[Torrey]

General updates from work in the lab so far today:

-The 1550 path is now well aligned to OFC2. The camera is very good in getting the alignment close, but minimizing the higher order modes is much more effective with a PD in transmission.

-I aligned a 1550 13 MHz bandwith PD to the flip up mirror TRANS path. This is quite annoying to do as the AOM has not been frequency matched to the 1550 light. There is almost no light transmitting.

-With the 1550 PD aligned I can minimize higher order modes resonant in the cavity. The alignment is now fine tuned and final, baring any minor touch ups as things get bumped. The configuration for the 1550 TRANS light can be see here: Down Up

-With a TRANS PD I can also match the AOM frequency such that the 775 and 1550 light are coresonant. The initial measurement can be seen here 3A193161-FFF8-4AB9-BD32-6A5FADD5ECE9.png. As seen the 1550 light is almost exactly midway between the 775 resonance peaks (at 200 MHz, this is the AOM optimal efficiency frequency). This means we need large AOM steps to get them coresonant.

-This new OFC2 cavity is using the new AOMs that arrived, they deflect the shifted beam way less. The one we borrowed from Ellie's lab could move +/- 1 MHz before completely losing all power going into the fiber. These can move +/- 15 MHz and still have some amount of power reaching the other side of the fiber. In fact, I can move a full 15 MHz, tune up the input coupler, move another 15 MHz, tune up, etc, very easily.** I've done this to make the 1550 and 775 light coresonant in OFC2. As seen here, the TRANS signal on the 1550 path and the zero point on the error signal on the 775 path are aligned. The frequency used to achieve this is 230.69 MHz. 


** I'm not sure the progress on the curved mirror AOM experiment but, this may even prove the that unnecessary. I would still like to see how well the curved mirror works though.

Images attached to this report
GQuEST General (GQuEST)
David Nguyen - posted 12:38, Tuesday 06 August 2024 - last comment - 08:17, Wednesday 07 August 2024(11805)
Transposed Direct Form Filter Noise Quantization
Continuing our studies on lowering bit precision, we turn our attention to the transposed version of the direct form filter. This is motivated by our desire to understand how different forms of the biquad filter perform under lower bit resolution, with specific attention to the system's response to noise. I have attached the same plot multiple times, each with different bit resolutions toggled off to highlight the behavior of particular curves. These plots are for a low-pass filter with a 10 MHz sampling frequency, a 10 kHz critical frequency, and an input tone of 12 kHz. For 15 to 35 bits, the digitization and readout noise remain unaffected, and there is also a similar overlay between 10 and 15 bits for higher frequencies. The interesting behavior to note is that when we reduce the resolution from 15 to 10 bits, we observe a counterintuitive decrease in noise level. Reasons for this behavior are unclear. However, 15 bits should be sufficient since increasing bit resolution beyond this does not decrease the noise level.
Images attached to this report
Comments related to this report
David Nguyen - 08:17, Wednesday 07 August 2024 (11808)
During yesterday's meeting, Lee pointed out an important missing detail in the plots I presented. I have corrected that and attached the updated versions to my previous post. The behavior described for the plots of my previous post remains unchanged.
Images attached to this comment
Lab Infrastructure Networking
Ian MacMillan - posted 10:06, Tuesday 06 August 2024 (11804)
Ethernet Connection to B102

B102 is disconnected from the other labs physically. It is required that we run our own network inside the lab. In this case we must connect B102 to the main lab (B111). We don't have access to the networking room so we cant run cable through there or use existing infrastructure to meet our requirements. I have run a cable through from the door of B102 to through the cable trays down along the floor past the elevators up the wall and through a cable tray to the pipe to the Electronics/Mech shop. The spool is outside the door of B102 because there is no way to get a cable into B102. The old cable through hole was covered up when they did the lab renovations. We will need a new hole which may be hard because B102 is a laser lab so we have to do it safely. See the attached pictures to see the cable run.

Images attached to this report
Lasers Amplifiers
Torrey Cullen - posted 09:43, Tuesday 06 August 2024 (11803)
1550 laser and Amplifier on

1550 nm Laser and Amplifier are turned on in B102.

Environmental General
Briana Chen - posted 12:40, Monday 05 August 2024 (11801)
780 nm laser back on

Turned 780 nm laser back on. Outside laser sign is on now.

Environmental General
Daniel Grass - posted 15:30, Saturday 03 August 2024 (11799)
Temperature in East Bridge during the Chilled Water Shutdown

At 3:28 PM Saturday, it's between 74°F in the postdoc office up to 78.5°F in B111A. It's around 96°F outside the building right now.

Atoms General
Briana Chen - posted 18:30, Friday 02 August 2024 (11798)
Pump path in place, probe beam error signal data collection issues

[Briana, Ian]

Finished mounting mirrors and placing items on breadboard for the pump path, not aligned yet until we can figure out how to take sufficient data for just the probe. We will probably use irises to align the pump and probe when the time comes.  

To extract the frequency noise in the system, we need the data of the error signal that we are locking to, the absorption dip (corresponding to the locking signal), and the ramp signal we are sending in. The ramp signal is used to convert to temperature and subsequently to wavelength, which can be used to find linewidth and the values of the error signal at some wavelength away from resonance. Once you get this, you can take measurements of the error signal when the laser is locked to get the amount of frequency drift/noise.

However, the Moku Pro multi-instrument mode can only produce outputs from 2 channels. We took out the Moku Go #2 so you can input two of the three signals and overlay them over the signals from the Moku Pro to match the temperature. This "increases" the number of channels you can measure. In the laser lock assist mode, you would not need three signals because it converts the x axis to the scanning voltage, which would eliminate the need for the ramp signal. However, you seemingly cannot export this data with the x-axis of voltage (see this image for what you see in laser lock assist mode: 2024-08-0217-48-39-0.png). If you can fit to the error signal and extract the linewidth parameter, you could get away with just two signals and not have to undergo the following issues, but that again does not rely on data so it's not ideal anyways.

I would take measurements with the single-instrument mode of the laser lock box but that gives a much weaker error signal (amplitude maybe 50 microvolts compared to the 300 microvolts in multi-instrument mode). I haven't figured out why- it could be that I am missing a setting although I'm pretty sure I have everything the same as multi-instrument mode.

Also locked with the slow controller after setting the fast controller to a gain of 0 and switching outputs: 2024-08-0217-49-25-0.png

One question I have is whether or not we need a Faraday isolator in the vapor cell setup. Because we have a half waveplate in front of the EOM to maximize efficiency, when the pump comes out of the EOM and back up to the beamsplitter (which would theoretically dump s-polarized light), the light may not be s-polarized so it may not actually get dumped. In this case, putting a Faraday isolator would prevent this light from going into the laser.  

All lasers, heaters have been turned off (including 780 nm lasers) and the light saying the laser is on is turned off. 

Images attached to this report
Equipment Loans
Daniel Grass - posted 17:29, Thursday 01 August 2024 - last comment - 16:45, Tuesday 13 August 2024(11797)
RFSoc Loaned to Hutzler Lab

[Alex, Daniel]

I loaned out our RFSoc to the Hutzler Lab. The point of contact is Harish Ramachandran. Also in the loan was the included power cord and some SMA connectors.

Comments related to this report
Daniel Grass - 16:45, Tuesday 13 August 2024 (11831)

The RFSoc has been returned. I placed it in the Cabinet in the EE area.

Images attached to this comment
GQuEST Output Filter Cavities
Torrey Cullen - posted 15:43, Wednesday 31 July 2024 (11796)
OFC2 775 Finesse measurements

In order to make finesse measurements I needed a faster (higher BW) PD in transmission of the cavity for ringdown measurements. I have installed a PDA05CF2 (note this is not rated for 775 but it is still between .1-.2 A/W responsivity at this wavelength). Because this PD is a much smaller area, it requires a lens to see any higher order mode flashes. It has been installed. The output configuration of OFC2 775 nm light has been slightly rearranged to optimize. 

I performed ringdown measurements similar to this log post. The results are seen in finesse.png. I was hoping to see a major difference in measured finesse of the cavity that had just been assembled vs one that had been on an optics table for months. The new cavity has slightly higher measurements, meaning slightly lower losses, but it is still a fair bit away from the quoted mirror specs. This corresponds to roughly 100 ppm loss per mirror vs 85 ppm loss per mirror on OFC1 vs OFC2.

It seems like the two cavities have roughly been dirtied the same amount. I think I may look into applying first contact to the superoptics while they are situated in the cavity.

Images attached to this report
Atoms General
Briana Chen - posted 17:51, Tuesday 30 July 2024 (11791)
Locking!!!

[Briana, Ian, Torrey]

Before exciting stuff: This morning, I noticed that photodetector saturation was occurring at 3.3 mW. All settings were the same as yesterday (Input 1 channel at 50 Ohms, 40 Vpp). The way that I returned to yesterday's voltage level was to switch to 1 MOhm and then switch back to 50 Ohm. For some reason, this gets you back to the higher voltage level. You also have to be at a high-enough power (>5 mW I want to say? Certainly 8 mW) for the lack of change between 1 MOhm and 50 Ohms to occur. I have no idea why- the change from 1 MOhm to 50 Ohm should change the voltage reading by a factor of 1/2. Either way, this process returned it to the voltage level from yesterday (~6 V). 

Retook some dip depth measurements to check repeatability- it seems repeatable within the error bars (power error bars are too small to be seen): dips.png (red and purple lines were taken today). Even at a different current, the saturation tends to occur around the same place. This is plotting absolute dip depth, which will help us determine at what power saturation occurs. Data is here: 7_26.xlsx

Shoutout to Torrey for figuring out that we need a high-bandwidth photodetector to detect the higher frequency signals, so we needed a PDA10A2 detector (150 MHz) instead of the PDA36A2 detector (12 MHz). We exchanged our 36A2 with Torrey's 10A2. The 10A2 has an active area of about 0.8 mm^2 (1 mm diameter ish), so we may need to add a lens to focus it down. We also added two ND filters (a 2 OD and 0.3 OD filter) so that only ~0.166 mW hits the detector. Both filters should be placed right before the photodetector so the light going through the vapor cell is still a high power. Will call Thorlabs to ask what the damage threshold is, but Torrey remembers it being around 1 mW, which is why we added the ND filters. 

The confusion with the attenuation of -40 dB automatically by the multi-instrument mode means that the signal in single instrument mode should be multiplied by 0.01 (-40 dB = 10 log (P2/P1) = 10 log (V2^2 / V1^2) so V2 = 0.01 * V1). This is approximately the case: mimvssim.png. There doesn't seem to be a way to change this, it may just be the way the MIM operates. It is probably fine too since we have a low power hitting the photodetector now anyways. 

Locking!:

We locked the laser to the main absorption dip!! See pictures of the error signal (errorsignal.png) and the result when locked (locked.png). It seems like the controller should operate at lower frequencies (15 Hz) to best lock, which Torrey pointed out is different from the kHz frequencies he is using for the cavity locks and means we could consider using the slow controller. Torrey definitely did not lock the laser or help at all. The next step is to better understand the locking process before Ian deletes it all. Also, should tune controllers/modulation frequency/phase to make sure the error signal is maximized. Setup is same as in the picture last post except now with a different photodetector and some ND filters. 

Images attached to this report
Non-image files attached to this report
GQuEST SHG (GQuEST)
Daniel Grass - posted 16:47, Tuesday 30 July 2024 (11795)
AOM path for OFC 3 starting to be built

[Torrey, Daniel]

I placed a 150 mm focal length lens after the PBS on the 3rd SHG path and setup the AOM on the 5 axis mount. I logged the AOM here and labeled it.

We will need a way of powering the AOM. I think we need more 2 W supplies. We also need irises. I am working on getting more irises.

GQuEST Output Filter Cavities
Torrey Cullen - posted 16:33, Tuesday 30 July 2024 (11794)
Filter cavity two lock acquired

Aligned a REFL PD, transferred EOM and laser current control to the newly (re)acquired moku (2), and acquired lock in the new filter cavity. Want to do some ringdown measurements on the new cavity tomorrow and see how the finesse compares.

Images attached to this report
Equipment Loans
Torrey Cullen - posted 11:02, Tuesday 30 July 2024 (11792)
Moku returned from Cryo Lab

I've taken our moku back that was on loan to the cryo lab. It is now underneath Moku 1 in B102. Below is documentation of the cables I had to unplug in the cryo lab in order to remove it from the lab.

-Initial State

-Left side labels & left side labels 2 - Note: input 4 was unlabeled and twisting deep into a spot with many BNC cables. I have labeled it "Unknown Moku Input 4" as seen in the photo.

-Right side labels & right side labels 2 - Note: 2 outputs are unlabeled but you can clearly see where they are originating.

-Back Side Labels & Back Side Labels 2 - Note: Both the ethernet and BNC on the backside were unlabeled. I have added labels "Moku Ethernet" and "Clock Ref In".

This will be duplicated on the ELog here

Images attached to this report
Displaying reports 501-520 of 1091.Go to page Start 22 23 24 25 26 27 28 29 30 End