[Jeff, Torrey]
Connected the large ThorLabs piezo mounted on cavity #2 directly to the Moku (no HV amplifier).
Transmission voltage -10.7mV (no light) -9.5mV (on resonance). The photodetector in transmission was selected to measure ringdowns, it is not rated for light below 800nm. Responsivity in amps/Watt is less than 0.1
Max error amplitute is 4mV pkpk, and locking with the piezo results in constant flashing, saturating the error signal.
What voltages are we giving the piezo? The Moku has output limits of 10V. Since the maximum amplitude of the error signal is 2mV, the maximum gain we can have in our controller before saturating the Moku output is 20log_10(10/0.002) = 74dB. This is definitely being exceeded at low frequencies, we will try the HV amplifier.
The piezo for cavity control is now routed through the HV amplifier. We are able to achieve better locks but still no where sufficient for stable cavity operation. The error signal is being saturated in both directions, same as before. After some trouble shooting, two things are definitively contributing to this poor lock. The fans being on causes a non-trivial amount of noise for the piezo to handle. Additionally we found that the 840 Hz known to be coming from the poor grounding on the DC modulation port of the laser is interfering somehow. With the HV source in play we can scan and lock fully on the piezo. Getting rid of the fans and this noise introduced by having a cable plugged in into the laser seems to give a quality of lock similar to that of locking only with the laser.
[Torrey, Jeff, Daniel]
Continuing work here, we maximized the power of the beam that's shifted twice by the AOM by changing the tip and tilt of the curved mirror. We are fairly confident that this is the correct beam because it doesn't move (very much) on the camera (~6" downstream of the AOM) when we change the input frequency of the AOM by 30 MHz. The power of this beam is 0.87 mW. I then aligned this beam into a fiber collimator and got a power of 0.73 mW. We then swept the AOM frequency to evaluate how much power still gets into the beam.
Below is a table with some data. The Assumed Output Power uses the AOM specs here. It assumes for reference a 0.87 mW power for 200 MHz and is proportional to the square of the efficiency.
AOM Input Frequency (MHz) | Assumed Twice Shifted Output Power (mW) | Measured Twice Shifted Power Through Fiber (mW) | Fiber Efficiency |
---|---|---|---|
200 | 0.87 | 0.73 | 84% |
170 | 0.60 | 0.6 | 100% |
185 | 0.82 | 0.69 | 84% |
215 | 068 | 0.61 | 90% |
230 | 0.60 | 0.48 | 80% |
I definitely don't trust the efficiency above ~85%, but I think this gives a very good indication that we can move the AOM frequency by ~60 MHz and still have enough light to lock the cavity. 0.48 mW would saturate the fast PD, so we need to use an ND filter anyway.
I think we should copy this scheme for future AOM setups and maybe go back and adjust the mirrors. I should note that I didn't do any fine adjustment of the location of the curved mirror whatsoever. Maybe we got lucky, but this hopefully means that the path is fairly easy to set up.
The next step is to verify that this is twice shifted light. I think the easiest way is to use it in a cavity.
[Torrey, Daniel]
We aligned the beam through a f = 150 mm lens, into the AA AOM, through an iris, through a quarter waveplate, and reflected back using a concave mirror (R = 100 mm). This use of the curved mirror intended to allow us to adjust the AOM frequency without needing to realign the beam into the fiber. We currently see 3 beams from the AOM after the PBS. We aren't sure which beam is which. In theory, the twice shifted beam will not move when we change the AOM frequency. In practice, this might not be the case. We will work on this next week.
Upoading files for display in confrence room
[Briana, Ian, Torrey]
Ian suggested that one reason why the tank circuit didn't work was because the capacitance is actually 12 not 14 picofarads based on the spec sheet that came in the EOM box (linked in a previous log post). This changes the inductance from 139 nH to 119 nH, which may be within the tolerance of the inductor we used but might still amplify the wrong frequency.
Thanks to Ian and Torrey for realigning the pump before I destroyed it. We are trying to mode-match the pump and probe beams through the vapor cell (concentrate more pump power to sharpen the dip), so using JamMt and beam profiling, two lenses (150 mm and 100 mm) were added to the pump path to reduce the beam size down from ~1600 microns to ~1300 microns. One issue is that once the light passed through the EOM, the beam profile began to look more clipped, so the x and y beam diameters were not the same and changed drastically. I think this is because the beam passing through the EOM is not constant in the z-direction, so more fine-tuning is required that I was not able to finish in time. By tuning the position of the EOM, the beam size can change significantly, so it is almost certainly the EOM alignment causing this issue. Currently, from the beginning to end of the vapor cell, the probe beam has a (x,y) beam profile of (1349, 1455) and (1405, 1545) microns respectively. For the pump, this was (1368, 1361) and (1383, 1386) microns at the beginning and end of the vapor cell respectively.
Spent some time varying the slow controller and there exists a peak around 40 Hz introduced by the locked laser (potentially due to the controller but unsure otherwise): example_peak_pt2.png, strangepeak.png show some different controller parameters. If you reduce the unity gain frequency and the gain, this peak gets damped down, which makes sense because the gain will be lower at that frequency. This peak could be a result of us driving the system at this frequency that is in resonance with something in the system, kind of like when you have a spring and you drive it at the right frequency to increase the amplitude but once you are at higher/lower frequencies to this peak you have a lower amplitude.
We achieved fast actuation by changing the current controller. We previously did not implement this because we thought power fluctuations might become too significant. We also failed to do so initially because we needed to amplify the signal to the current controller by +14 dB in the Moku settings. On 8/21, we took data with the fast controller but the error signals looked extremely bad: horrendous_dip.png, plateau_errorsignal.png. Although the calibrated error signals for the 8/22 data also looks ugly, this one is worse because the error signal strangely plateaus. After plugging in a terminator to the BNC cable and unplugging, this plateau no longer occurred. This points to the potential fluctuations in the current controller due to the new connection from the MOD OUT port with the BNC cable. Still, the data from 8/21 shows that the slow controller is doing something. By locking and then unlocking the slow controller, we get the noise spectrum on the right side of this image: slowvsfast.png. The following are the settings used to take this data: settings.png. The controllers used were shown here: slowcontroller.png, fastcontroller.png.
The following is the error signal used for the 8/22 data. When the signal is not calibrated, it looks pretty smooth: uncalibratederrorsignal.png. Upon calibrating, the overall error signal looks bad: uglyerrorsignals.png. This is not because of the sample acquisition rate. I am pretty sure this is because the current value may be fluctuating now that we have it connected to the BNC cable/Moku. What we can do to test this is to plug in the current output to a Moku input, convert that voltage reading to current, and perform the interpolation for current similar to the one we do with temperature using the laser specs. This calibrates using a potentially varying current value along with the varying temperature value. Doing this would require three data loggers though, which is not super efficient.
On 8/22, we retook data after fixing the error signal plateau-ing. We obtain the following noise spectra: Probe(withoutpump).pdf, Probe(withpump).pdf, which matches what we expect with a lower noise in the locked laser. The controllers used to lock are: slowcontroller_822.png, fastcontroller_822.png. After calibrating with the error signal (which gave us slopes of ~3.4 V/THz and ~21.6 V/THz for the probe and probe with pump respectively, showing the improved frequency discrimination), we get the following noise spectra: NoiseSpectra.pdf. This seems good but we should keep the following in mind.
Some other to-dos:
Fixed issue with terrible calibration: the temperature scan signal was weirdly noisy (see CorrectedTempscan.jpg), so I did a linear fit to smooth it over and used these values to perform calibration. This led to updated calibration values for the slope of the linear region: Probe: Slope (V/nm): -1.659, Slope (V/THz): 3.415 | Probe with pump: Slope (V/nm): -13.004, Slope (V/THz): 26.2367
Attached are the fixed calibration graphs: err_signal_with_pump.pdf, err_signal_without_pump.pdf. The updated noise spectra with these slopes is found here: NoiseSpectra.pdf.
Cavity alignment was not recoverable. I most likely spent way too much time trying to recover instead of just starting from scratch. This is frustrating for future first contact cleaning if this cleaning procedure does improve the cavity finesse. The proccess I tried was the following:
1. Assume input alignment was unchanged, place both input couplers back on the cavity. Adjust input couplers to align both light paths back on their refl PDs. With how small the diode is on the high BW REFL PDs this should ensure 2 mirrors in their original position.
2. Piezo mirror (775 output coupler) is static and cannot be changed. Nothing to be done there.
3. Scan around on third adjustable mirror and look for any second pass beams on the camera.
It seems to me like this should work, but this did not yield anything.I believe the piezo mirror is at a drastically different angle, which is strange because when I was doing piezo science before, changing out the piezos did not drastically change the intercavity alignment. I started over by changing the input alignment of the 1550 light and adjusting the cavity mirrors to match the 3D printed alignment tools. Doing this instead I found cavity flashes within an hour. Realigned the REFL and TRANS light onto the cameras/PDs and fine tuned alignment. OFC1 1550 light is now aligned. With the newly built tank circuit the error signal on the 1550 path looks very clean. I believe the frequency of the modulations is not quite correct and can be looked into further. I have taken ringdown measurements to see if cleaning was successful, but am getting finesse numbers greater than the specs of the mirrors. I think this may be due to the TRANS pd being saturated? Going to retry. Also need to double check the 1550 TRANS PD is fast enough, although for the 1550 light the decay time should be on the order of 3300/pi/c*2.4 = 8e-6 s or 100's of kHz. I think all the PDs we have should be this fast.
Additionally, i took off the 775 input coupler and tried to match the input alignment. As built, the 775 light first sees the piezo mirror after the input coupler. For any given input alignment the piezo mirror is putting the beam into the metal casing of the cavity. Need to explore this still.
Wow, that's awesome to hear. Good optics and good procedures.
Update:
Retook the measurement, making sure to move the laser frequency away from equilibrium enough via the output offset, so that when I break lock no new light is resonant and I am purely measuring the light exiting the cavity. Additionally reduced input power slightly so that the PD is not saturated. Did two measurements in transmission of the cavity and find finesse measurements very close to the specs of the mirror. I think more analysis is needed (align 775 and do similar measurements) but we may be able to conclude that the mirrors were simply dirty coming from the manufacturer. Plot attached. It seems like this may be worth doing for the second cavity.
Super optic cleaning prep notes:
I've moved the bin of extra OFC parts to the other table in order to clear room on the OFC table. This will allow us to keep the exposed super optics inside the clean room at all times. I've set up a prep area on the OFC table closest to the door to B102. I have cleaned a pair of metal tweezers (the plastic ones in trials were very staticy), all of the required hex keys, and moved the first contact supplies to this location.
Currently my plan is to fully remove the ~2 inch spacer/flexture mount combination along with the optic. It would be possible to unscrew the nylon tip set screw that holds the mirrors in place but this seems like it adds unneeded risk and the flexture mount combinations can be removed/replaced and still retain inter-cavity alignment.
The piezo mirror must be fully removed in order to access the mirror. I have set aside an SM1 ring spanner wrench and piezo alignment tool to be cleaned when I am garbed up.
Two of the mirrors on one side (OFC1:FCM2 and OFC1:FCM4) are too close to a beamsplitter (OFC1:BS2) to remove. This BS must be removed from the table temporarily. I have done this.
End of preparation for first contacting particle count 0/0/0 and 1/0/0 during two 60 second count trials.
** Lunch**
Midway particle count: 0/0/0
Plan is to clean both the HR and AR sides. I think the way to do it is rest the optic on the AR side, paint the HR side, let this side dry, flip it and paint the AR side while the optic is resting on the painted HR side, wait til both are dry, remove both sides without resting the optic and install back into mount.
HR side first contact complete. Piezo mirror was visibly dirty. Looked like metal shavings. The AR side also had a large imprint on it from the piezo being driven a couple of times. Similar to what we've seen in the past.
AR side first contact complete. Mirrors are resting on dry HR side. Waiting 10 more minutes and then peeling.
Cleaned the inside circular part of the spacers that hold the mirror. The piezo mirror mount one had what looked like small metalic particulates.
All 8 peels were very successful. I noticed some specs (most likely stringing from the FC) on the AR side of OFC1:FCM1. Repainted this side while it was in its mount. Peel was successful. Reinstalled the mirrors on the cavity and now will scan and look to realign.
End of work particle count: 0/0/0
[Jeff, Daniel, Sander]
We have moved the TMC optical tables into close to their 'final' positions, according to the designed lab layout (see attached). We extended the caster wheels in the tables, which allows them to be moved around with two people pushing and one person guiding the table. The east table is not pushed up to the other table fully. We need to find some way to do this without bumping the tables into eachother and end up with both tables in the final desired positions. Note that the table tops are raised when the wheels are extended (vs. wheels retracted) and that the breadbord table tops protrude slightly from the base of the top (i.e. there's a horizontal 'lip' at the top), which makes this more difficult.
Some observations:
- As mentioned previously, the tabletops are not rigidly attached to the legs. This means the tops can and will move slightly on the tops of the pistons (which are on top of the legs) that the tabletop rests on, limited only by friction. The only thing preventing the top from moving completely off the legs are the earthquake stop bars.
- It seems the heads of the pistons (black part in photo), are not aligned with the bodies of the pistons (silver part in photo); inadvertently moving the top w.r.t the legs probably caused this misalignment. This misalignment is quite bad for some of the legs (see photo).
- The table tops do not rest equally on all four legs, there are visible gaps between the tops of the pistons and the top (see photo). This is probably because the lab floor is not level.
I think we can do the final movement by extending wheels on both tables, so that the breadbord lips are at the same height and the tables can recoil when pushing them together. Then we can try to slowly push the tables together so there's no gap, which will likely move the tables away from their desired final position. Then we could put e.g. a breadbord over the seam to make a rigid connection, after which we can do the final positioning, moving both tables at the same time.
You have the SHG sled and power distribution on this diagram twice just fyi.
[Alex, Torrey, Daniel]
We made and tested the amplifiers for the GQuEST AOMs. They work well.
Steps:
One end should be unused
Shielded BNC solder procedure:
Use 10 gauge solid, go 3/4” down, strip plastic away
Remove some extra ground strand
Twist exposed ground strand together
Use 14 gauge stripper, expose ~3/8” of copper wire
When soldering, make sure only pin touches BNC
I still want to add some wire mesh to shield the back from RF but allow for air to flow to the amplifiers.
Alex made the power supply seperate from this chassis. I will let him comment on how to make that.
I've set up an account number for techmart for our lab to purchase high purity N2 from AirGas. The account number is 4890116.
[Briana, Ian, Torrey]
Probe measurements again:
Retook spectra with just the probe to compare the results from using the matplotlib psd function (will switch to numpy), shown here probe_psd_python.png, and the Moku spectrum analyzer, shown here: probe_psd_moku.png. Data was taken for the photodetector input Moku channel at 50 Ohm impedance and 1 MOhm impedance to test at "different gains," although this does not really affect digitization noise since the signal would have already been digitized upon reaching the Moku- changing gain would have to happen before the Moku entirely. Regardless, the units of the y-axis are different between these two images but the order of which has the highest to lowest noise should be the same. However, the Moku spectrum analyzer provides less resolution so the shapes (especially <10 Hz) are not easily comparable and I am generally having a hard time trusting the spectrum analyzer. The general order of highest to lowest noise is somewhat consistent at <10 Hz. For 50 Ohms, after moving the offset of the temperature controller completely off the temperature at which the absorption occurs, we somehow see less noise compared to when the laser is locked, which is very bizarre. It is possible that the laser may just become very stable at that random temperature that I detuned to. Also, the noise level for the spectrum analyzer at higher frequencies is offset in the spectrum analyzer, in contrast to the post-processing method which shows what we would expect: noise at higher frequencies is the same across all three cases because the actuator does not implement control at those frequencies. I'm not sure why the spectrum analyzer behaves like this.
Attempts to amplify signal: We want to amplify the signal to reduce effects of bit noise, even though we amplify other noise in the process. Dominating bit noise could be one cause of these confusing noise spectra.
Built tank circuit for the EOM to enhance the error signal as much as possible. Resonant EOM seems to occur at 123 MHz after optimizing phase shift for different modulation frequencies. The EOM has capacitance of 14 picofarads. For a resonant frequency of 122.9 MHz, this means we get an inductance of L = (1/2pi f)^2 / C ~ 119 nano Henries. The resulting tank circuit did not work: touching the BNC cables even slightly changed the error signal significantly, and the signal was not amplified- in fact, the amplitude was larger without the tank circuit. We will proceed without the tank circuit for current time constraints. Connections are fine in the circuit (tested with the silver remote box), but maybe the components/connections are not secure and thus extremely sensitive to the environment/movement.
We want to amplify the light passing through the vapor cell before reaching the Moku (i.e. getting digitized), so we tried adding a low noise amplifier (LNA). I stole the one from the new lab which somehow works better (less noisy signal) than the one in the beige cabinet in B102 even at the same settings. However, amplifying the signal (with lowpass filter on the LNA set to the highest setting of 1 MHz) caused the error signal to become <20 microvolts in amplitude compared to the previous >400 microvolts in amplitude without the LNA, no matter how the modulation frequency/phase is tuned. The error signal also becomes a distorted symmetric shape. I think this is a filtering issue with the lowpassing. Although the photodetector signal from the temperature scan looks the same as without the LNA, maybe the modulation signal strength is not strong enough (the one getting mixed with the photodetector signal) to produce a significant amplitude for the error signal. Additionally, the error signal is very sensitive to moving the BNC cable to the EOM when connected to the LNA. Without the LNA, the error signal is not sensitive to BNC cable movement, so this is some issue with the LNA. Some of its specifications (from here) should also be considered when troubleshooting, although I don't think they are the sole reason for these problems: 1). the output type is a 100 Ohm BNC, so we might want a 100 Ohm BNC cable attached instead of a 50 Ohm (?) and 2). the input to the LNA must be between -0.4 and 0.4 V to get accurate readings (this is fine with our input signal, which usually doesn't even reach 200 mV). We are proceeding without the LNA for now. One idea to troubleshoot would be forking two outputs from the LNA into the Moku, one AC and one DC coupled. AC removes the DC offset so this coupling means that only AC signals will pass through, effectively acting as a lowpass filter. If the error signal is prominent in AC coupling, it could mean we just have an issue with the settings for modulation frequency/phase/low-pass filter in the Moku.
Pump:
Took data of the pump, will analyze this to see what hyperfine transitions they correspond to. Pump fell out of alignment so needs realigning. On Tuesday, we achieved lock! We took 20 seconds of 5000 samples per second for the locked and unlocked cases using the same method as with the probe and we get the following PSD: pump_noise_spectrum.png. The unlocked case has higher noise than the unlocked case, which is what we would expect. It is not immediately obvious why this seems to behave as we expect and not the probe, but I wouldn't trust it yet since we did this very quickly and only once so far (also the modulation frequency/phase/alignment were not optimized). Slow controller used and error signal: controller_20240813_193716_Screenshot.png. Blue dot in image shows the peak that we locked to. Also, the standard deviation of the error signal when locked was ~2.12 e-6 V whereas when unlocked, it is 3.72 e-6 V, which also matches with what we expect since the error signal would be greater and fluctuate more for an uncontrolled unlocked laser.
Current setup: IMG_2454.jpg
[Torrey, Ian]
A theory on the poor finesse measured on the OFCs has been that the mirrors are simply dirty. After hearing Hartmut mention that their optics were dirty straight out of the box from the supplier has convinced me to move forward on cleaning the OFC super optics. Koji has kindly agreed to oversee on Monday at 1 PM. In preperation for this I am going to take up to date measurements of the filter cavities to directly compare to after the cleaning. Currently the plan is to take an updated mode scan, ringdown measurement, and power budget (this has some flaws due to the poor lock quality but we will do our best). In addition, a quick inventory check before this happens:
-Fresh First contact - Yes
-Peek Mesh - Yes
-Clean scissors - Can clean a pair ahead of time
-Clean Forcepts/Tweezers - Same as above
-High purity N2 with a regulator - this we do not have. I think this can be purchased on campus and obtained very quickly but would ask Lee's approval.
-Top Gun - Yes.
In terms of data taking:
Cav Scan and updated ringdown measurements can be seen in "Nextcloud\GQuEST\B102\Output Filter Cavities\PreFirstContactData\"
OFC1
-1550 input - 15.6 mW
-1550 trans - 3.7 mW * 2 (through 50:50 BS)
-1550 refl - 5.2mW
I do not think the 1550 path loss is this bad. As previously discussed it is hard to optimize the 1550 output while locked on 775.
-775 input - 50 uW
-775 REFL - 4 +/-1 uW
-775 TRANS 46 uW
Update to this. Koji came into the lab and gave me some useful tips for first contacting. I've also been emailing with Koji and Garilynn. Couple points for everyone:
-AirGas (the vendor) is on techmart, this is who people use to buy high purity N2 for first contact purposes. I've set up an account for the Lee Lab. Should be able to see it on the website later today.
-Conversly Garilynn thinks its probably fine to clean these small mirrors without N2. The point of N2 is when peeling the dried first contact it can cause static build up, this is not as big of a problem with the small mirrors we are using.
-Last point that is worth mentioning is that LIGO "cleans and bakes" the mesh they use to peel FC. Garilynn pointed out an alternate peel method of putting a small drop on the edge of the optic and use this to initiate the peel.
We are currently wondering why the 1550 nm light is not co-resonant with the 775 nm light, used to lock the GQuEST Output Filter Cavities, over time. Some ideas are the AOM frequency drifts (unlikely), but a potential culperate is differential length changes of the cavity due to thermooptic effects (thermal expansion and thermo-refraction). For light that hits the surface of the coating, Evans (2008) (Eq. 3) gives the sensitivity of the sensed position of the mirror \Delta T to temperature fluctuations T as
\[ \frac{\partial \Delta z}{\partial T} = \bar{\alpha}_c h_c - \bar{\beta}\lambda \]
Where \bar{\alpha}_c is the effective coefficient of thermal expansion, h_c is the coating thickness, \bar{\beta} is the effective thermo-refractive coefficient, and \lambda is the wavelength. This expresion doesn't work for the 775 nm light since it is below a layer of 1550 nm coating. Assume a fraction (\gamma) of the coating is for 1550 nm light and (1-\gamma) of the coating is for 775 nm light. \gamma \approx 0.5, although the 775 nm light coating is probably thinner since the fractional wavelength stacks are thinner. This analysis might also not be exact for the mirrors since none of them are HR for both wavelengths.
\[ \frac{\partial \Delta z_{775~\text{nm}}}{\partial T} = (1-\gamma)\bar{\alpha}_c h_c - \gamma\bar{\alpha}_c h_c(n-1) - \bar{\beta}( \gamma h_c+\lambda) \]
Where n is the index of refraction of 775 nm light in the 1550 nm coating. There is a minus sign in front of it because a higher index causes more phase to be accumulated than in air.
Now consider the differential sensitivity of the sensed position of the mirror, assuming the thermorefractive coefficient is very roughly the same for both wavelengths.
\[ \Delta \frac{\partial \Delta z}{\partial T} \equiv \frac{\partial \Delta z_{1550~\text{nm}}}{\partial T} - \frac{\partial \Delta z_{775~\text{nm}}}{\partial T}\]
\[ \Delta \frac{\partial \Delta z}{\partial T} = \gamma h_c (\bar{\alpha}_c n + \bar{\beta}) \]
Plugging in numbers from our GQuEST Paper Table II,
\[ \Delta \frac{\partial \Delta z}{\partial T} \approx 2 \cdot 10^{-10}~\text{m/K} \]
I'm not sure if ~1/1000 of a wavelength can explain the drift in the co-resonance over time.
Using Delta f /f = Delta l / L, where f is the frequency of the light and L is the length of the cavity, we get 16 kHz / K, not enough to explain the overnight drift of ~ 1 MHz. Lee points out that this temperature dependence might be enhanced by the quarter and half wavelength stacks.
[Briana, Ian]
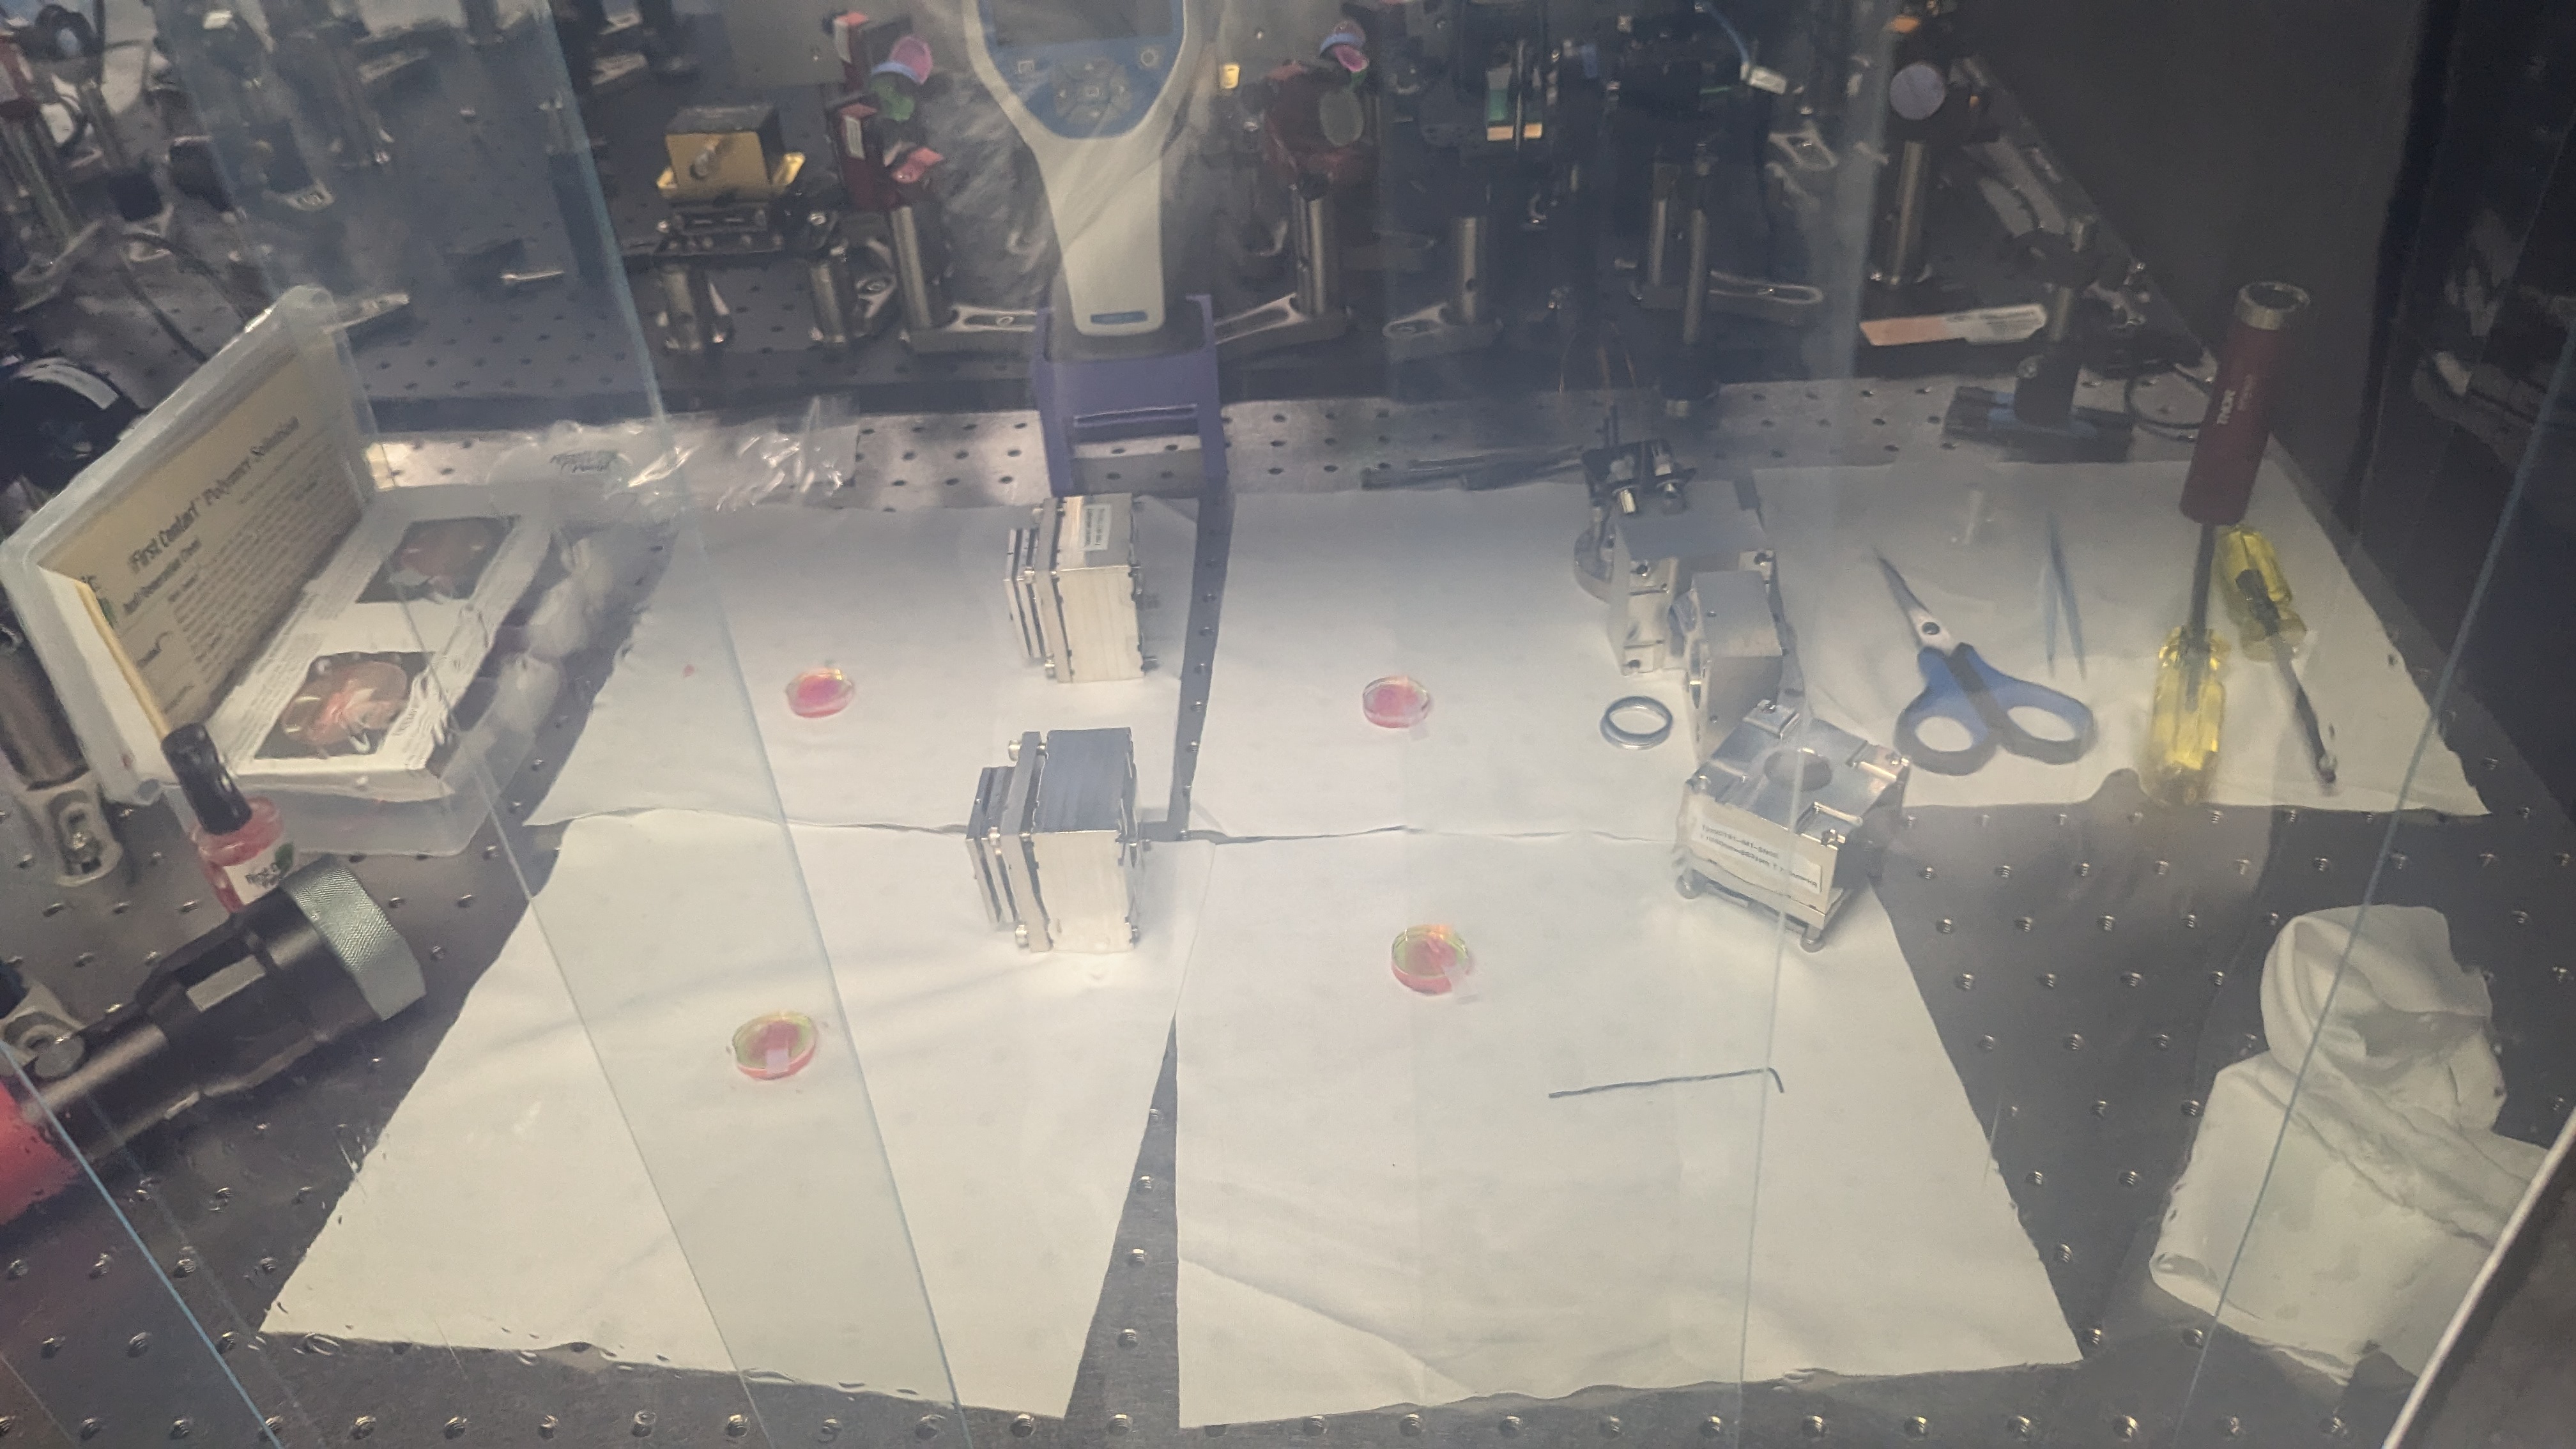
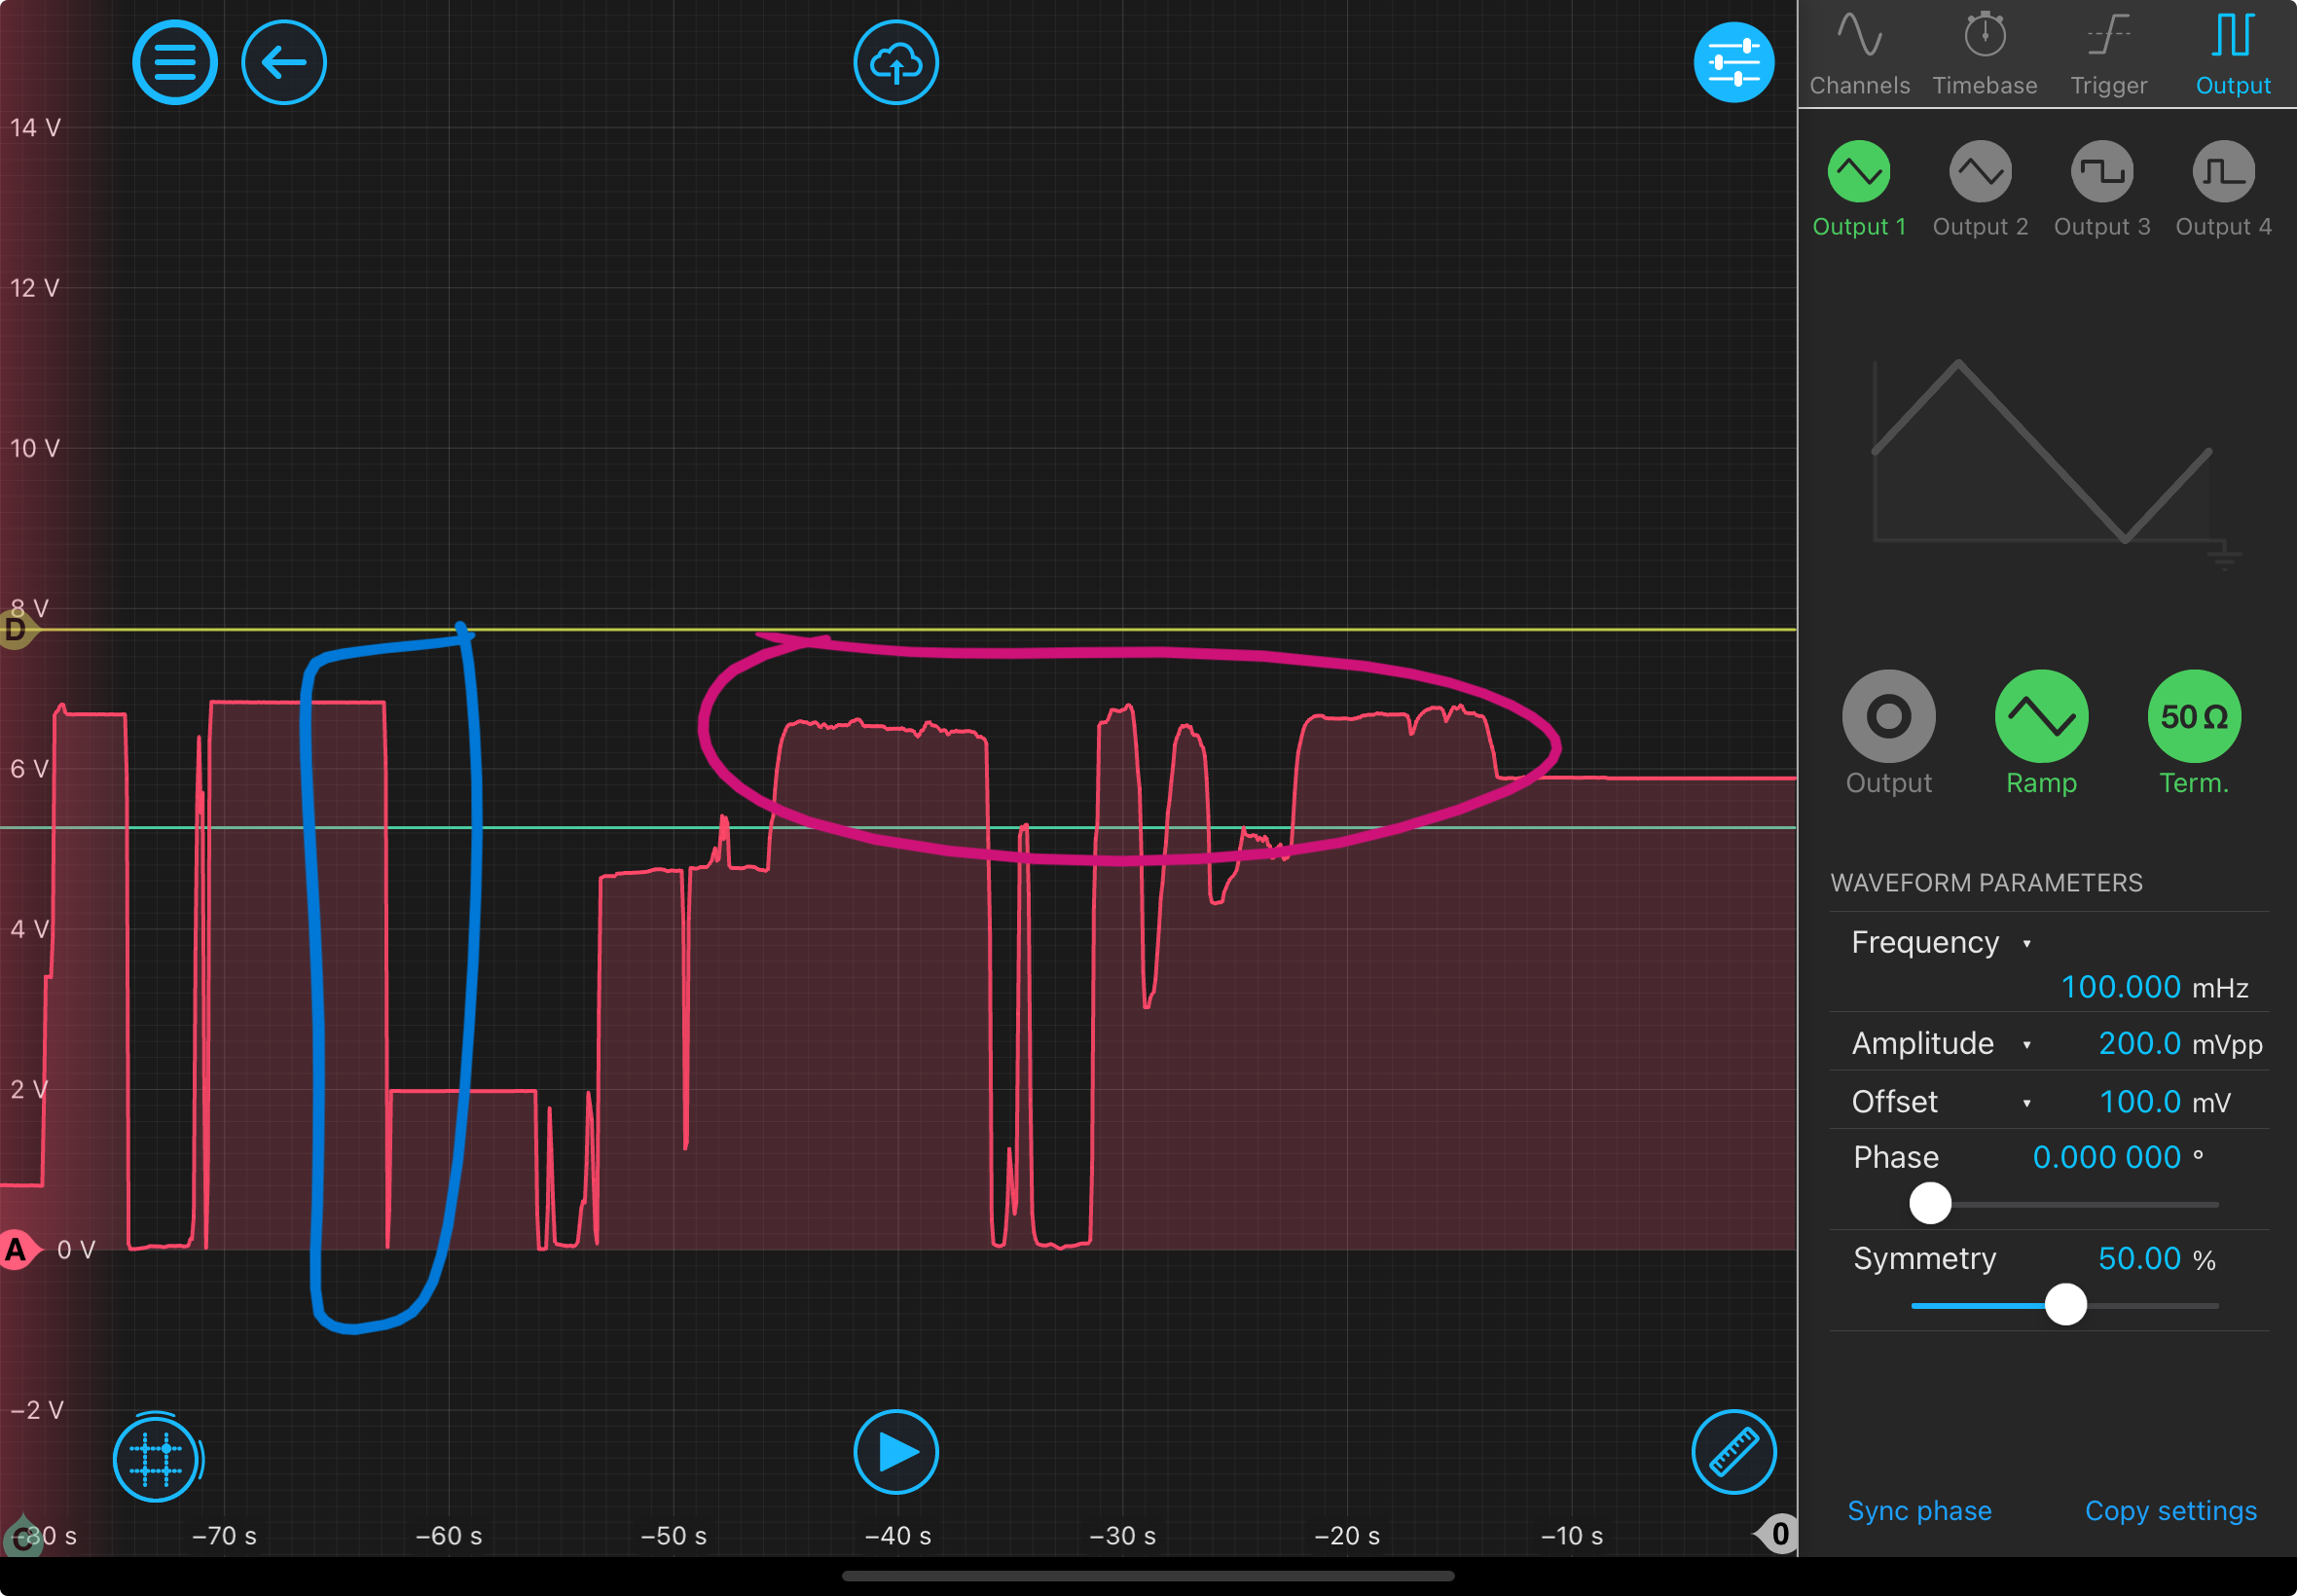
7/18: Started taking data with a 150 mm lens in but messed up wavelength in JamMt and alignment so data is void. However, from the initial look at that data, it seemed like putting in the lens removed the finer dips within larger dips (some of the absorption features are getting lost). However, wouldn't trust this too much because the alignment was bad. When I removed the lens, there was a dip in transmittance (blue circle) but by shifting the photodetector around, you can get back to a level close to the original with-lens measurement, although there is some noise (red circle), (see rip_alignment). This leads me to also think the issue in the last post could also be an alignment problem. However, I am not sure as I don't think I touched anything that would move it out of alignment, but who knows.
7/19: Realigned and measured for the 150 mm lens. First, I scanned across temperature with the lens in place. Then I removed the lens and scanned. Then I put the lens back in its original place, beam profiled the vapor cell, and moved the photodetector to see if I could get the same power level. I measured the beam profile on the active area of the photodetector, right before entering the vapor cell, and right after the vapor cell. The issue was the order in which I did this because it required a lot of putting the lens back to where it was, which might not have been accurate. A more consistent procedure is discussed below. At this point I also put in a 0.2 OD ND filter to not saturate the blue nanoscan beam profiler (didn't find a setting to increase saturation limit in the program).
7/21-7/22: Took data with the 100 mm lens (at 25 Celsius on 7/21, at 40 Celsius on 7/22). This is the procedure going forwards (can be repeated for the different focal lengths):
First, profile the beam. The laser power should not affect the beam profile but for consistency, set the laser current at 110 mA, temperature at 6.755 kOhms. Set the position of the lens and vapor cell (everything is relative to the mirror before the beam enters the vapor cell). Record the positions of where the vapor cell will begin/end, where the lens will be. Beam profile at the beginning of the vapor cell without the lens in place and record the location. Put the vapor cell in place. Beam profile after the vapor cell without the lens and record the location. Determine the location of the photodetector where the waist should be. Ensure that the beam profile you measure at the photodetector is within the 3.6 mm by 3.6 mm aperture and record the location/beam profile. Put photodetector down and mark the location. Slightly tune the positioning of the photodetector until you can see good dips (this was largely unsuccessful, I'm not sure how the tuning works). Do the scans/measurements (NO LENS). Put the lens in place. Confirm that the light falling onto the photodetector is the same as without the lens by checking alignment. Do scans (WITH LENS). Put in the beam profiler where the photodetector is (keeping the lens in place), which will require removing the photodetector. Then, beam profile after the vapor cell. Remove vapor cell and beam profile right before the lens.
Using Torrey's beam profiling code and Jammt, you should be able to determine the beam size reasonably accurately. I was running into issues where the beam size I measured differed by >3 mm from JamMt because I should have picked 'thick lens' on the JamMt settings (not thin lens). With this fixed, there is a ~1mm difference in beam size than expected. Could be explained by error in distance measurements. Moving forward, I'll verify the distance measurements more accurately to see if this is the issue. Because I was having trouble with JamMt, I had started profiling the beam in the sequential manner, so I think the values for the beam size are correct, but just are not verifiable with JamMT.
Results:
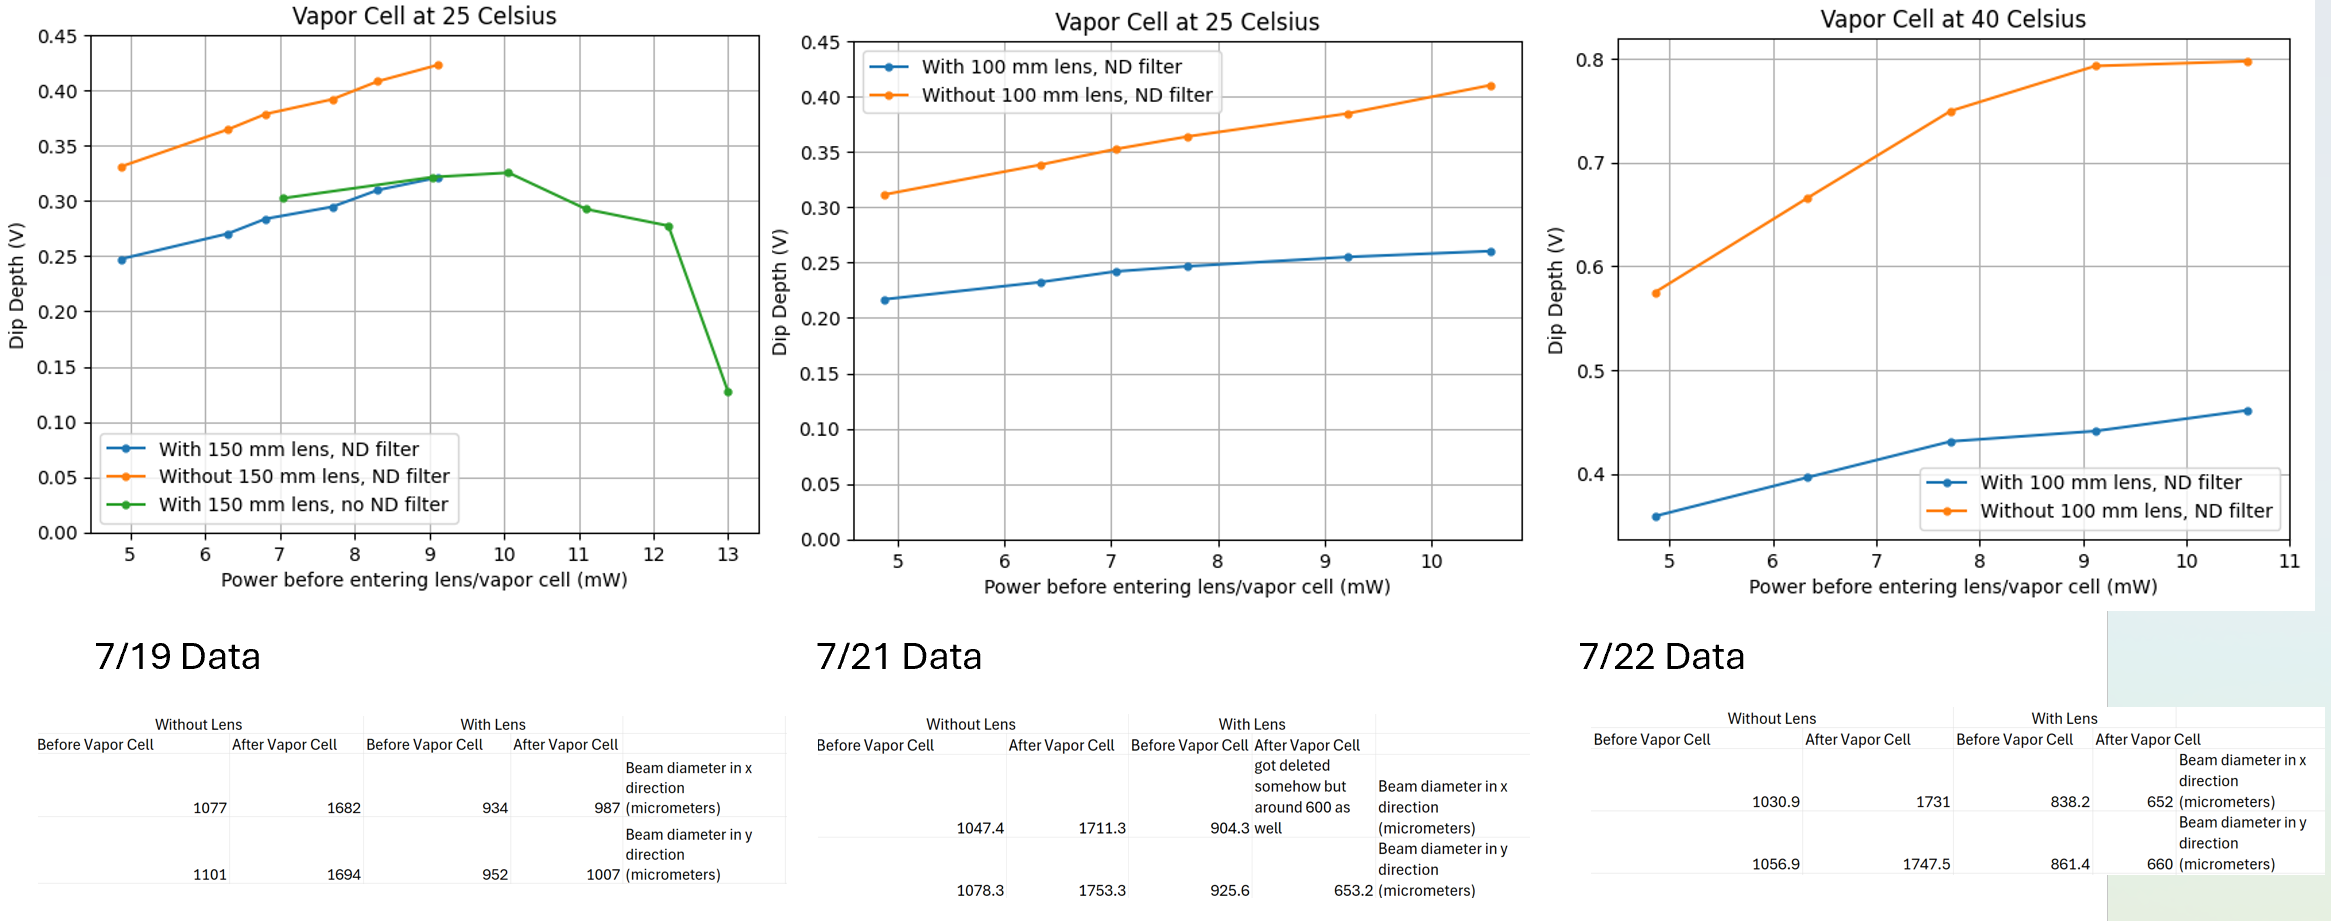
The dip depth comparisons from all the data are shown here with the measured beam sizes (DipDepthComparison.png). Even at a different vapor cell temperature, the smaller beam size decreases the strength of the absorption dip (the 150 mm lens produces a smaller beam size by about ~1 mm). I want to justify this by saying that a smaller beam size means photons will interact with a lower number of atoms so less photon absorption occurs (in contrast, a larger beam means photons are more likely to be absorbed because they interact with more atoms). I feel like you would be saturating the atoms by bombarding them with photons, but I'm not sure if there are too many atoms for this to occur (spontaneous emission process is too fast?). Something I'll look into/calculate.
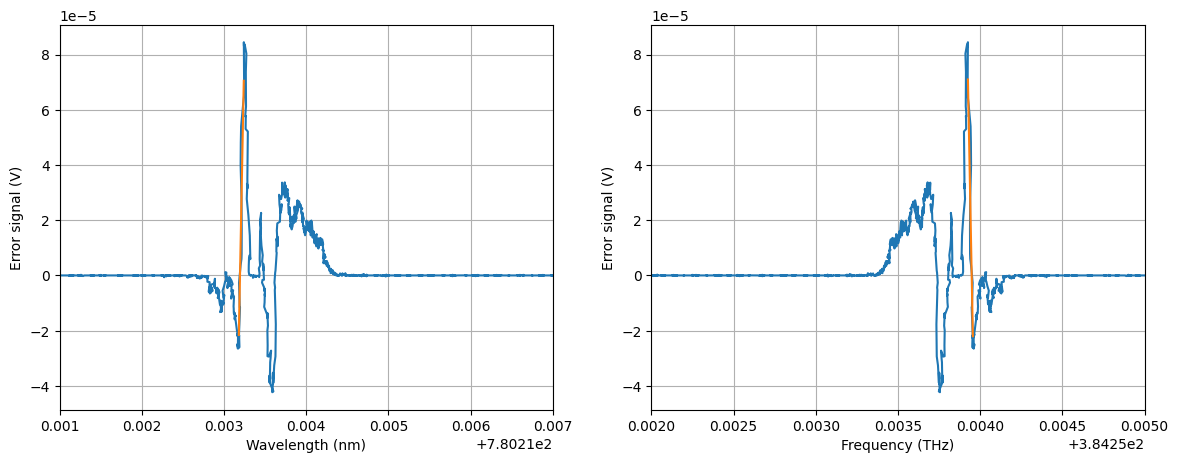
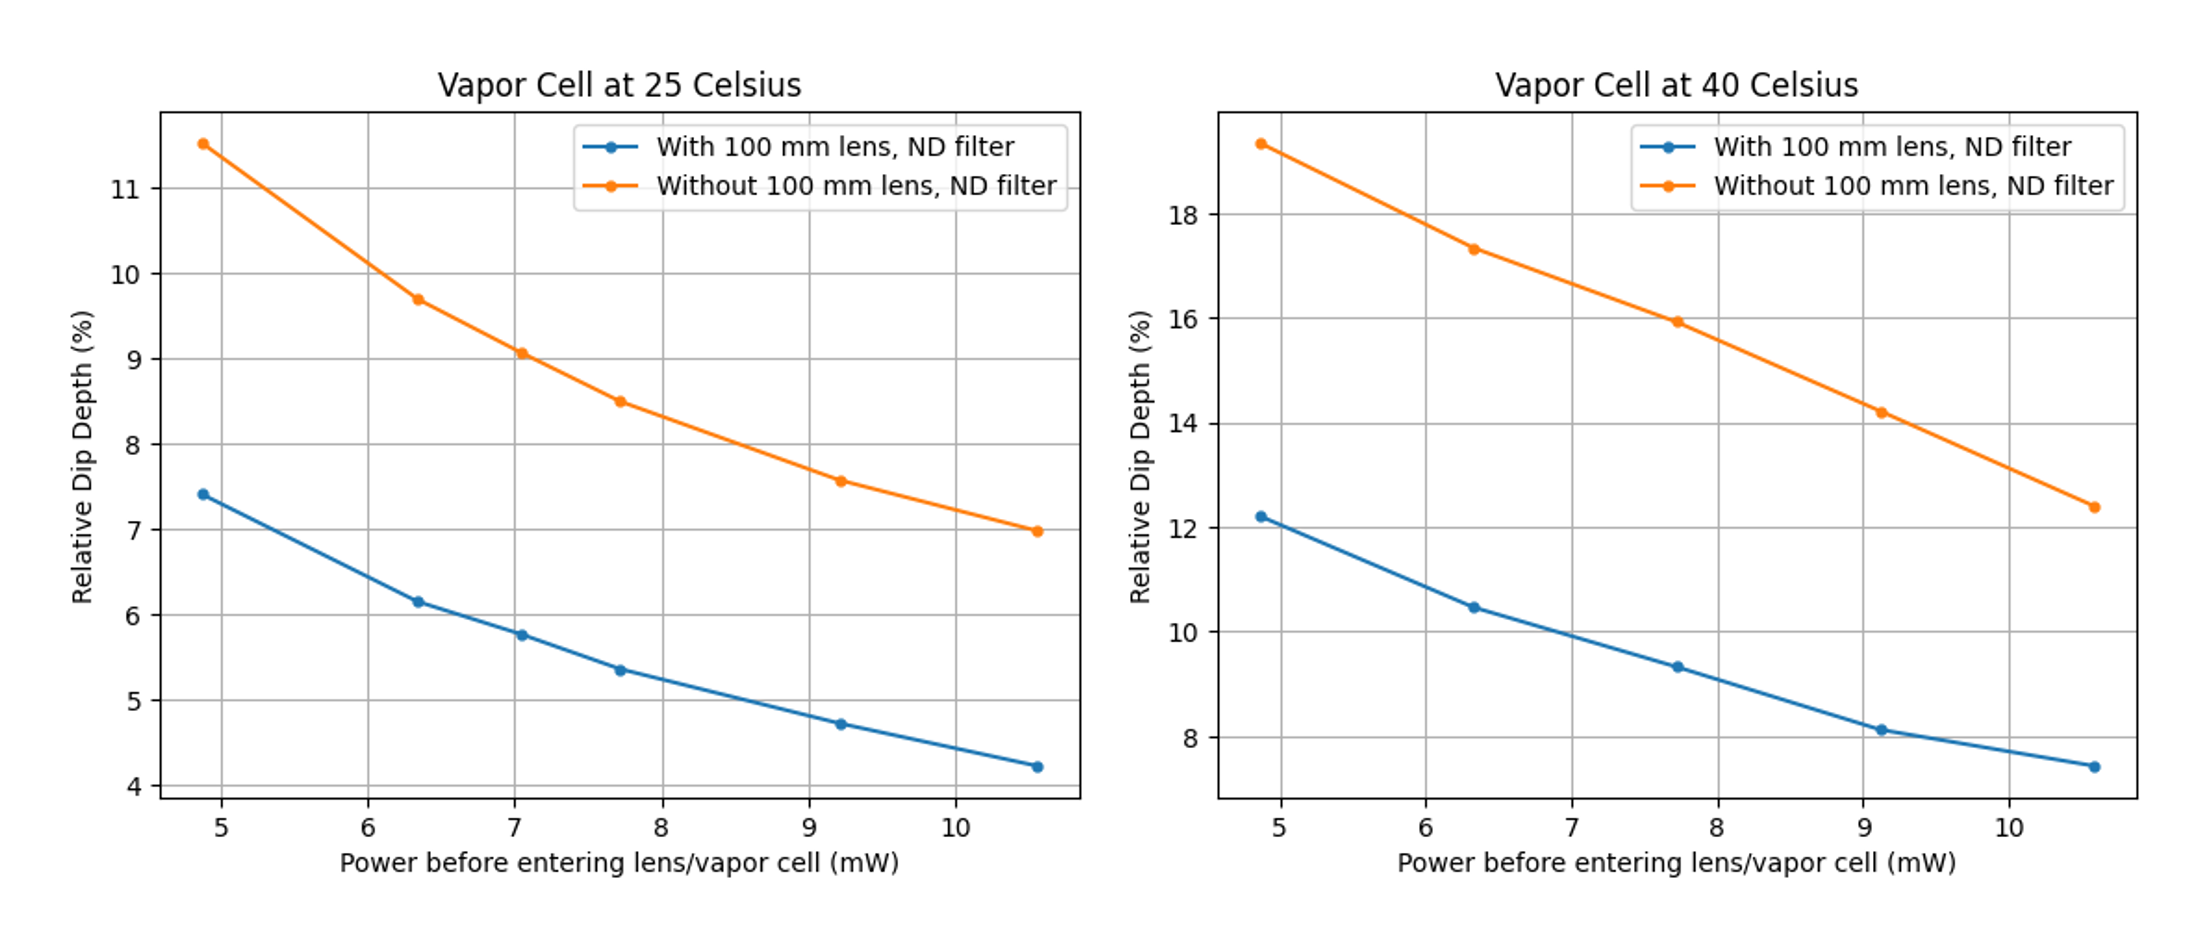
Also, if you plot the relative dip depth (1 - background voltage / signal voltage), you see that it decreases as you increase power, which would make sense as the increase in absolute dip depth is not enough to overcome the larger increase in background power (relative_dip_depth). This could also explain the saturation effect that we see (dip depth becomes less pronounced once you increase power too much).
From the 7/19 plots, it seems like there is a power limit before the dip depth begins to decrease, which is due to some saturation effect. I want to say that this is a saturation limit on the photodetector, but as Ian pointed out it could be an issue with the Moku, so I should measure the power before reaching the photodetector to confirm. Based on the manual, if the photodetector is reading over 5V for a 50 Ohm load (which is what the Moku is set to), then it will saturate, but the output has consistently exceeded 5V output reading and has still retained an increasing dip depth. Should double check settings.
Smaller absorption features (on both dips) are still getting lost. If you get the right alignment, you can see the dips. Maybe the photodetector needs to be a certain distance away to register it but I'm not sure why/how since all the light is getting concentrated onto the active area anyways.
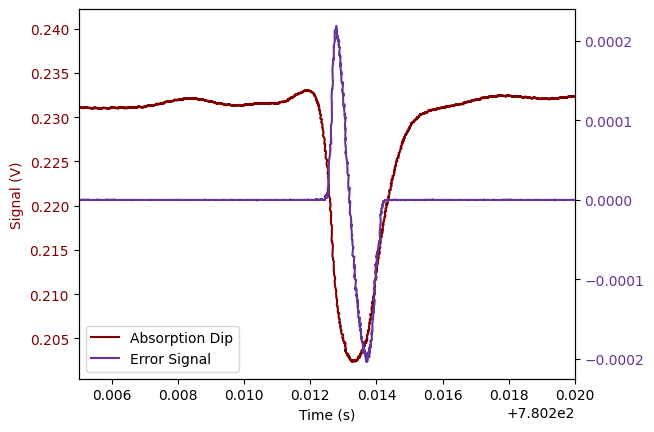
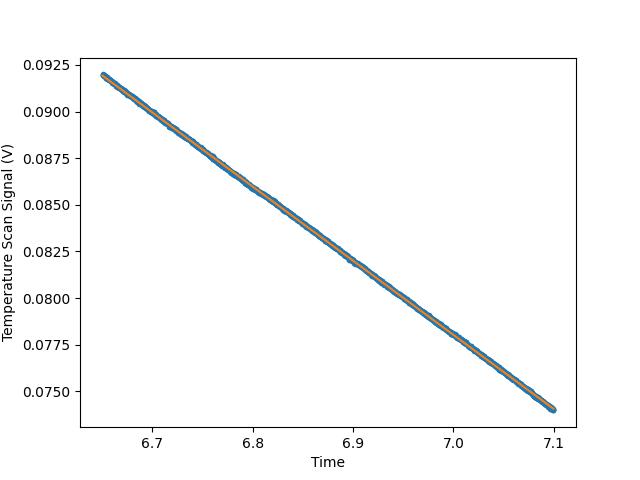
The way I measure the dip depth is to take the ends of the temperature vs. reading plot and fit an exponential to it (because the shape of the temperature curve sometimes trails up towards higher temperatures and is not a linear background). After subtracting it, I get something like the second slide. subtracting_background_example.pdf. Before I was doing it by hardcoding indices, so this should be better and easier to verify.
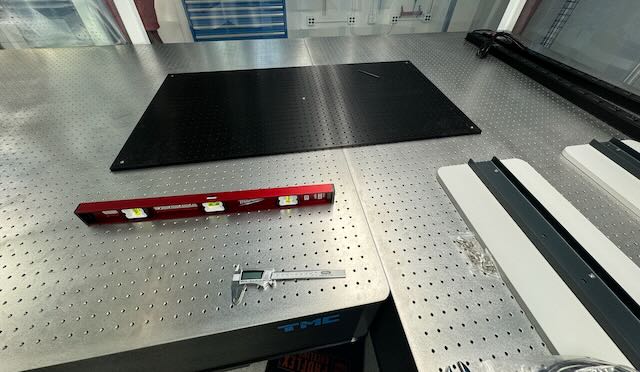
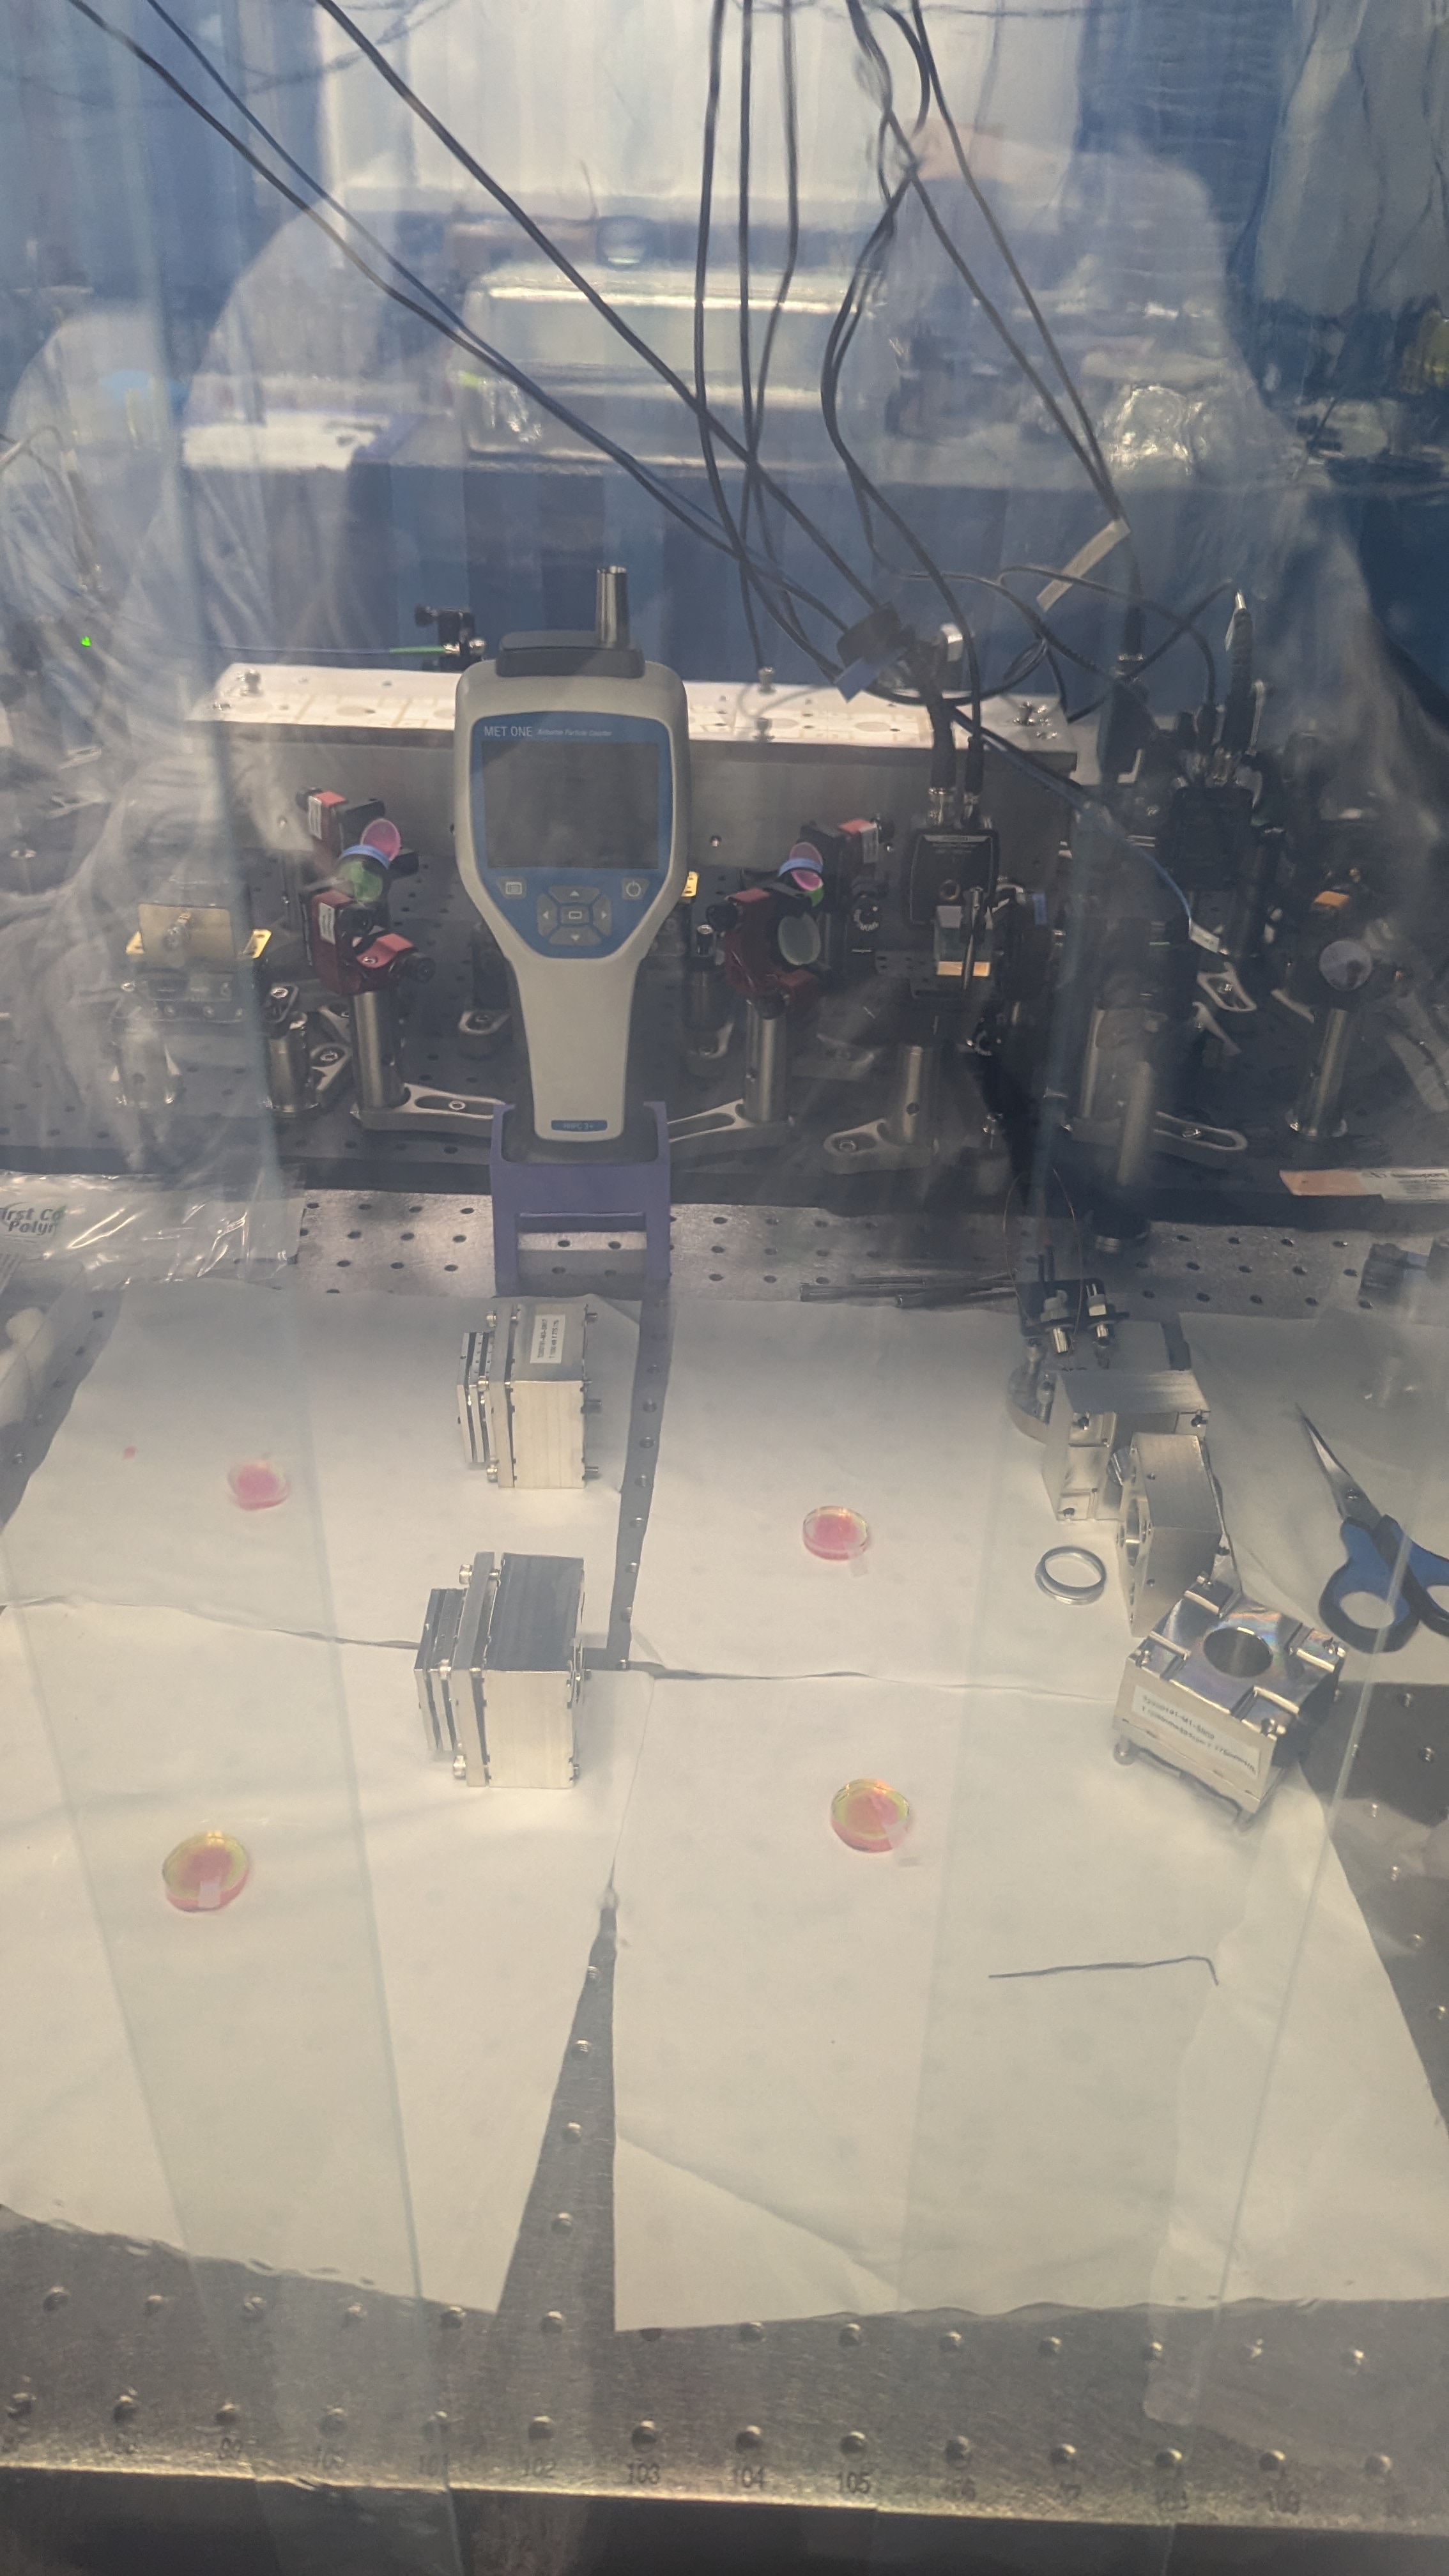
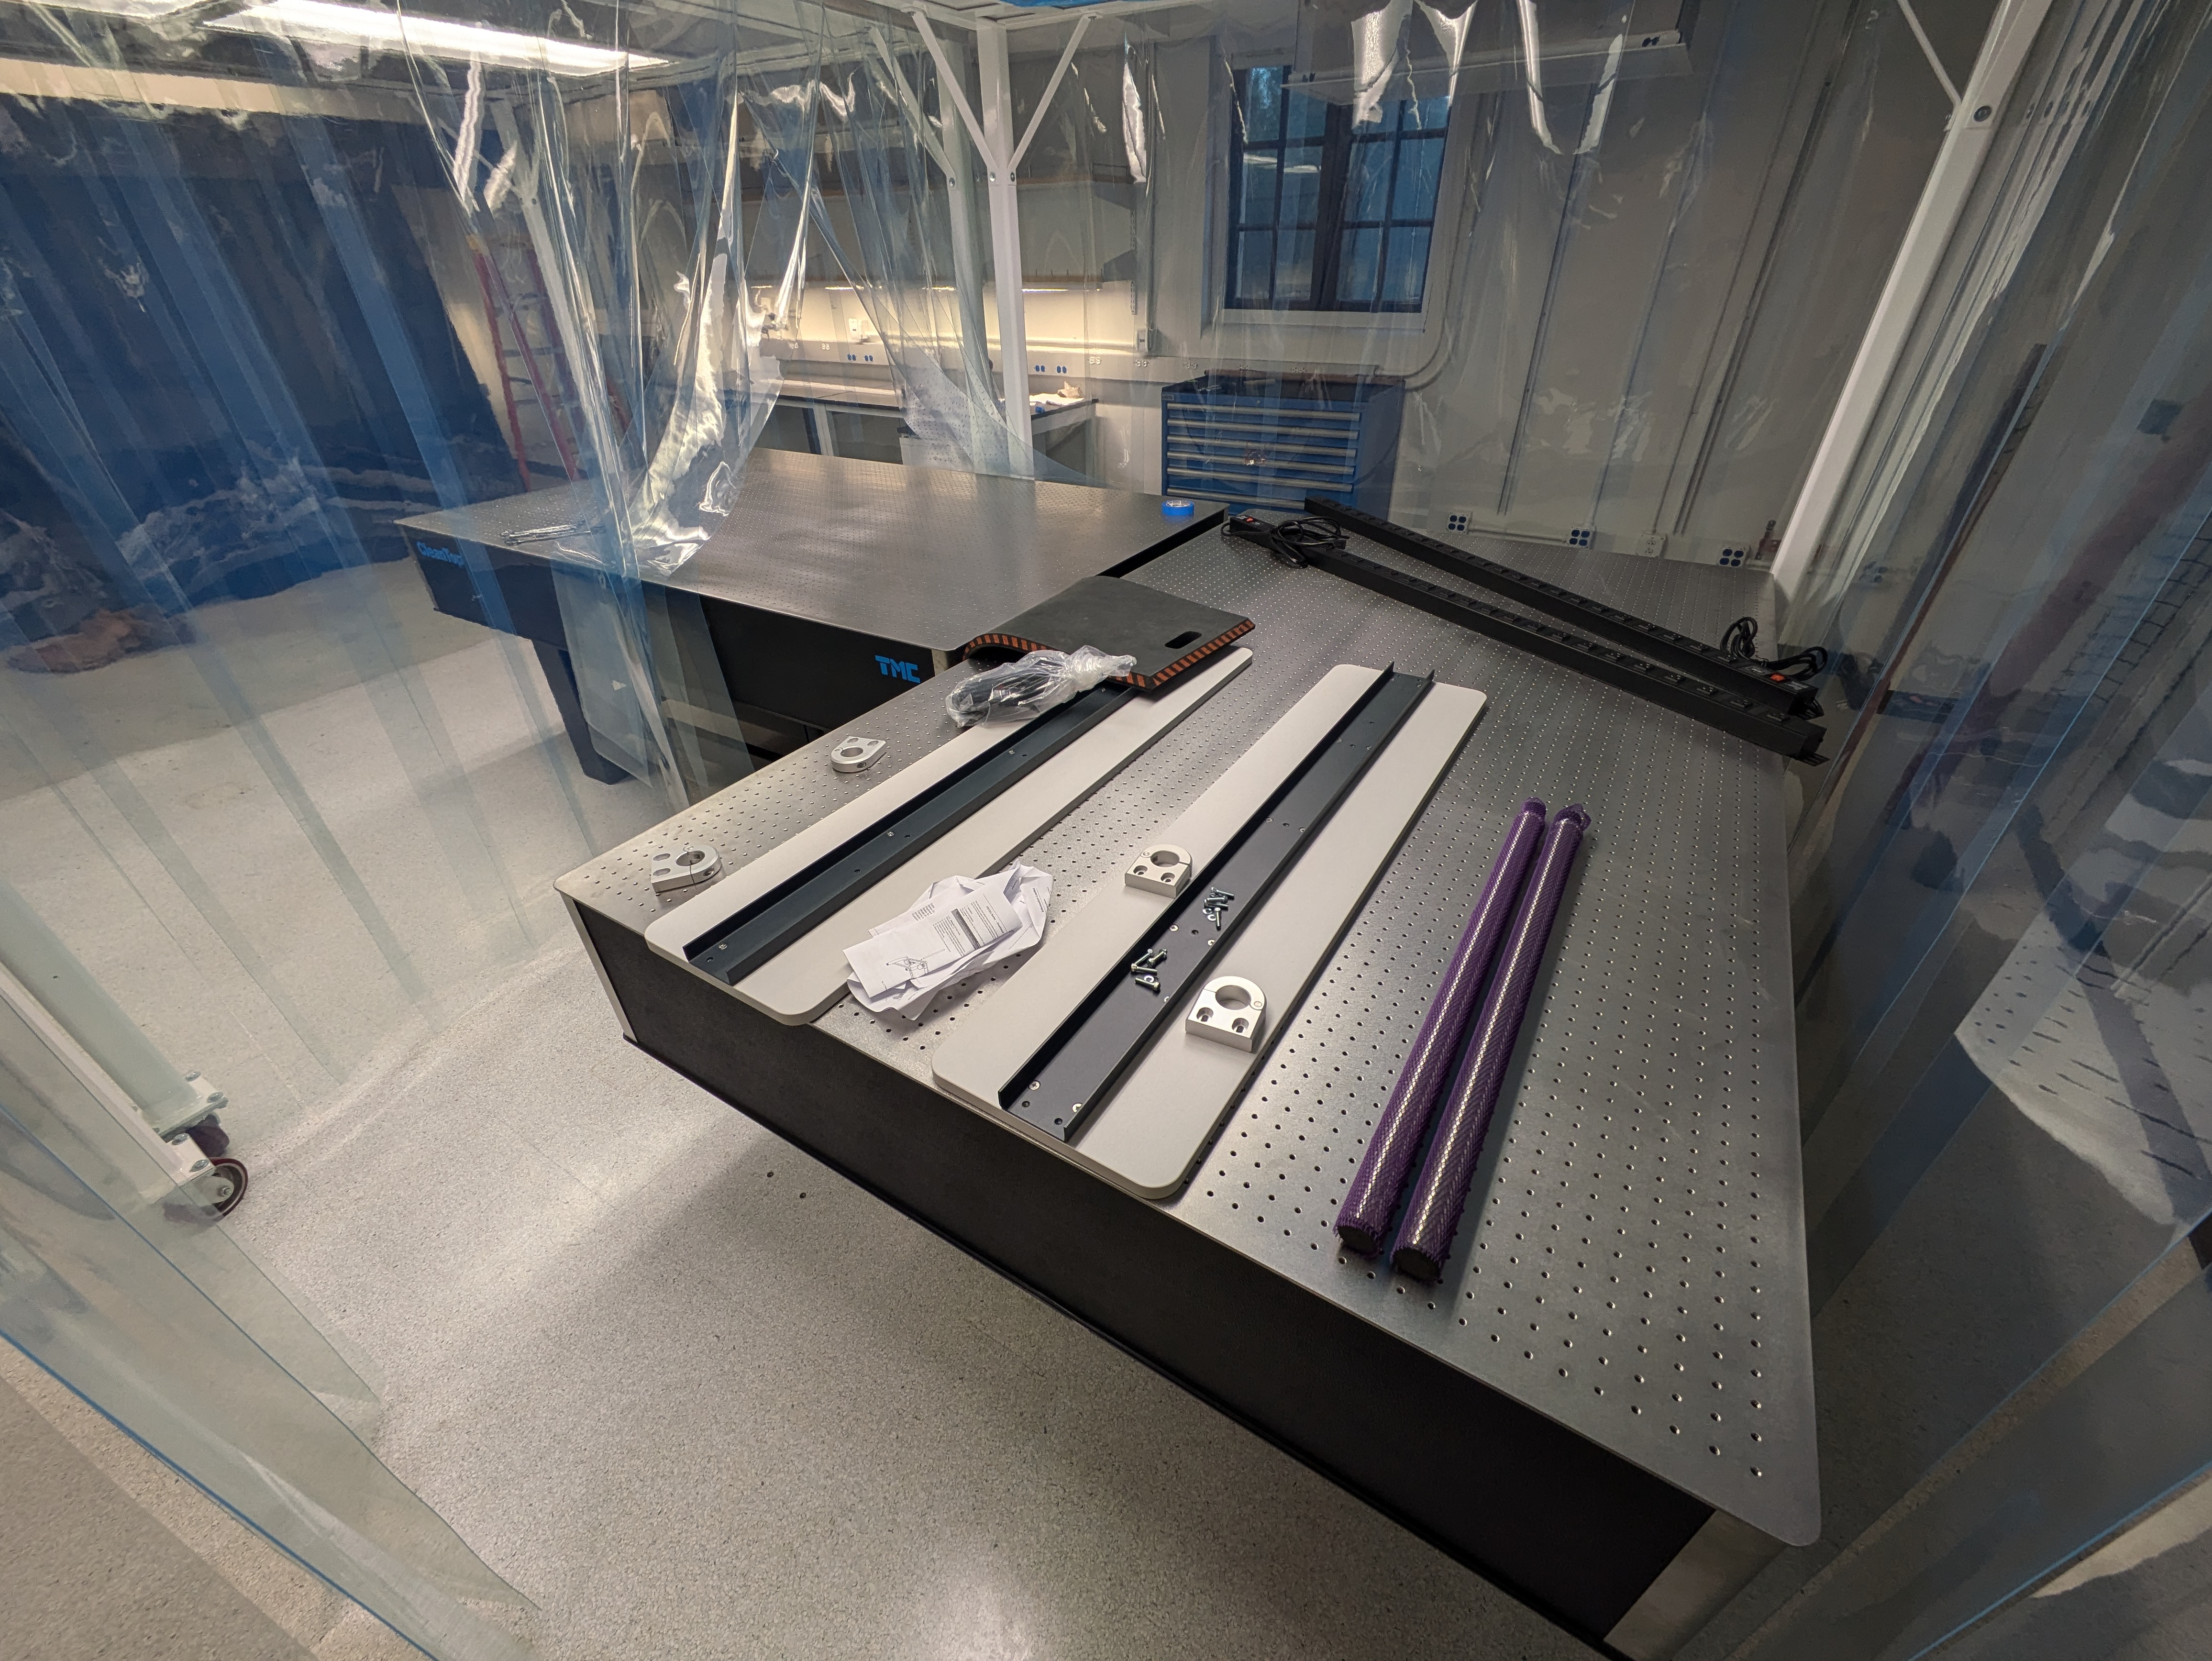
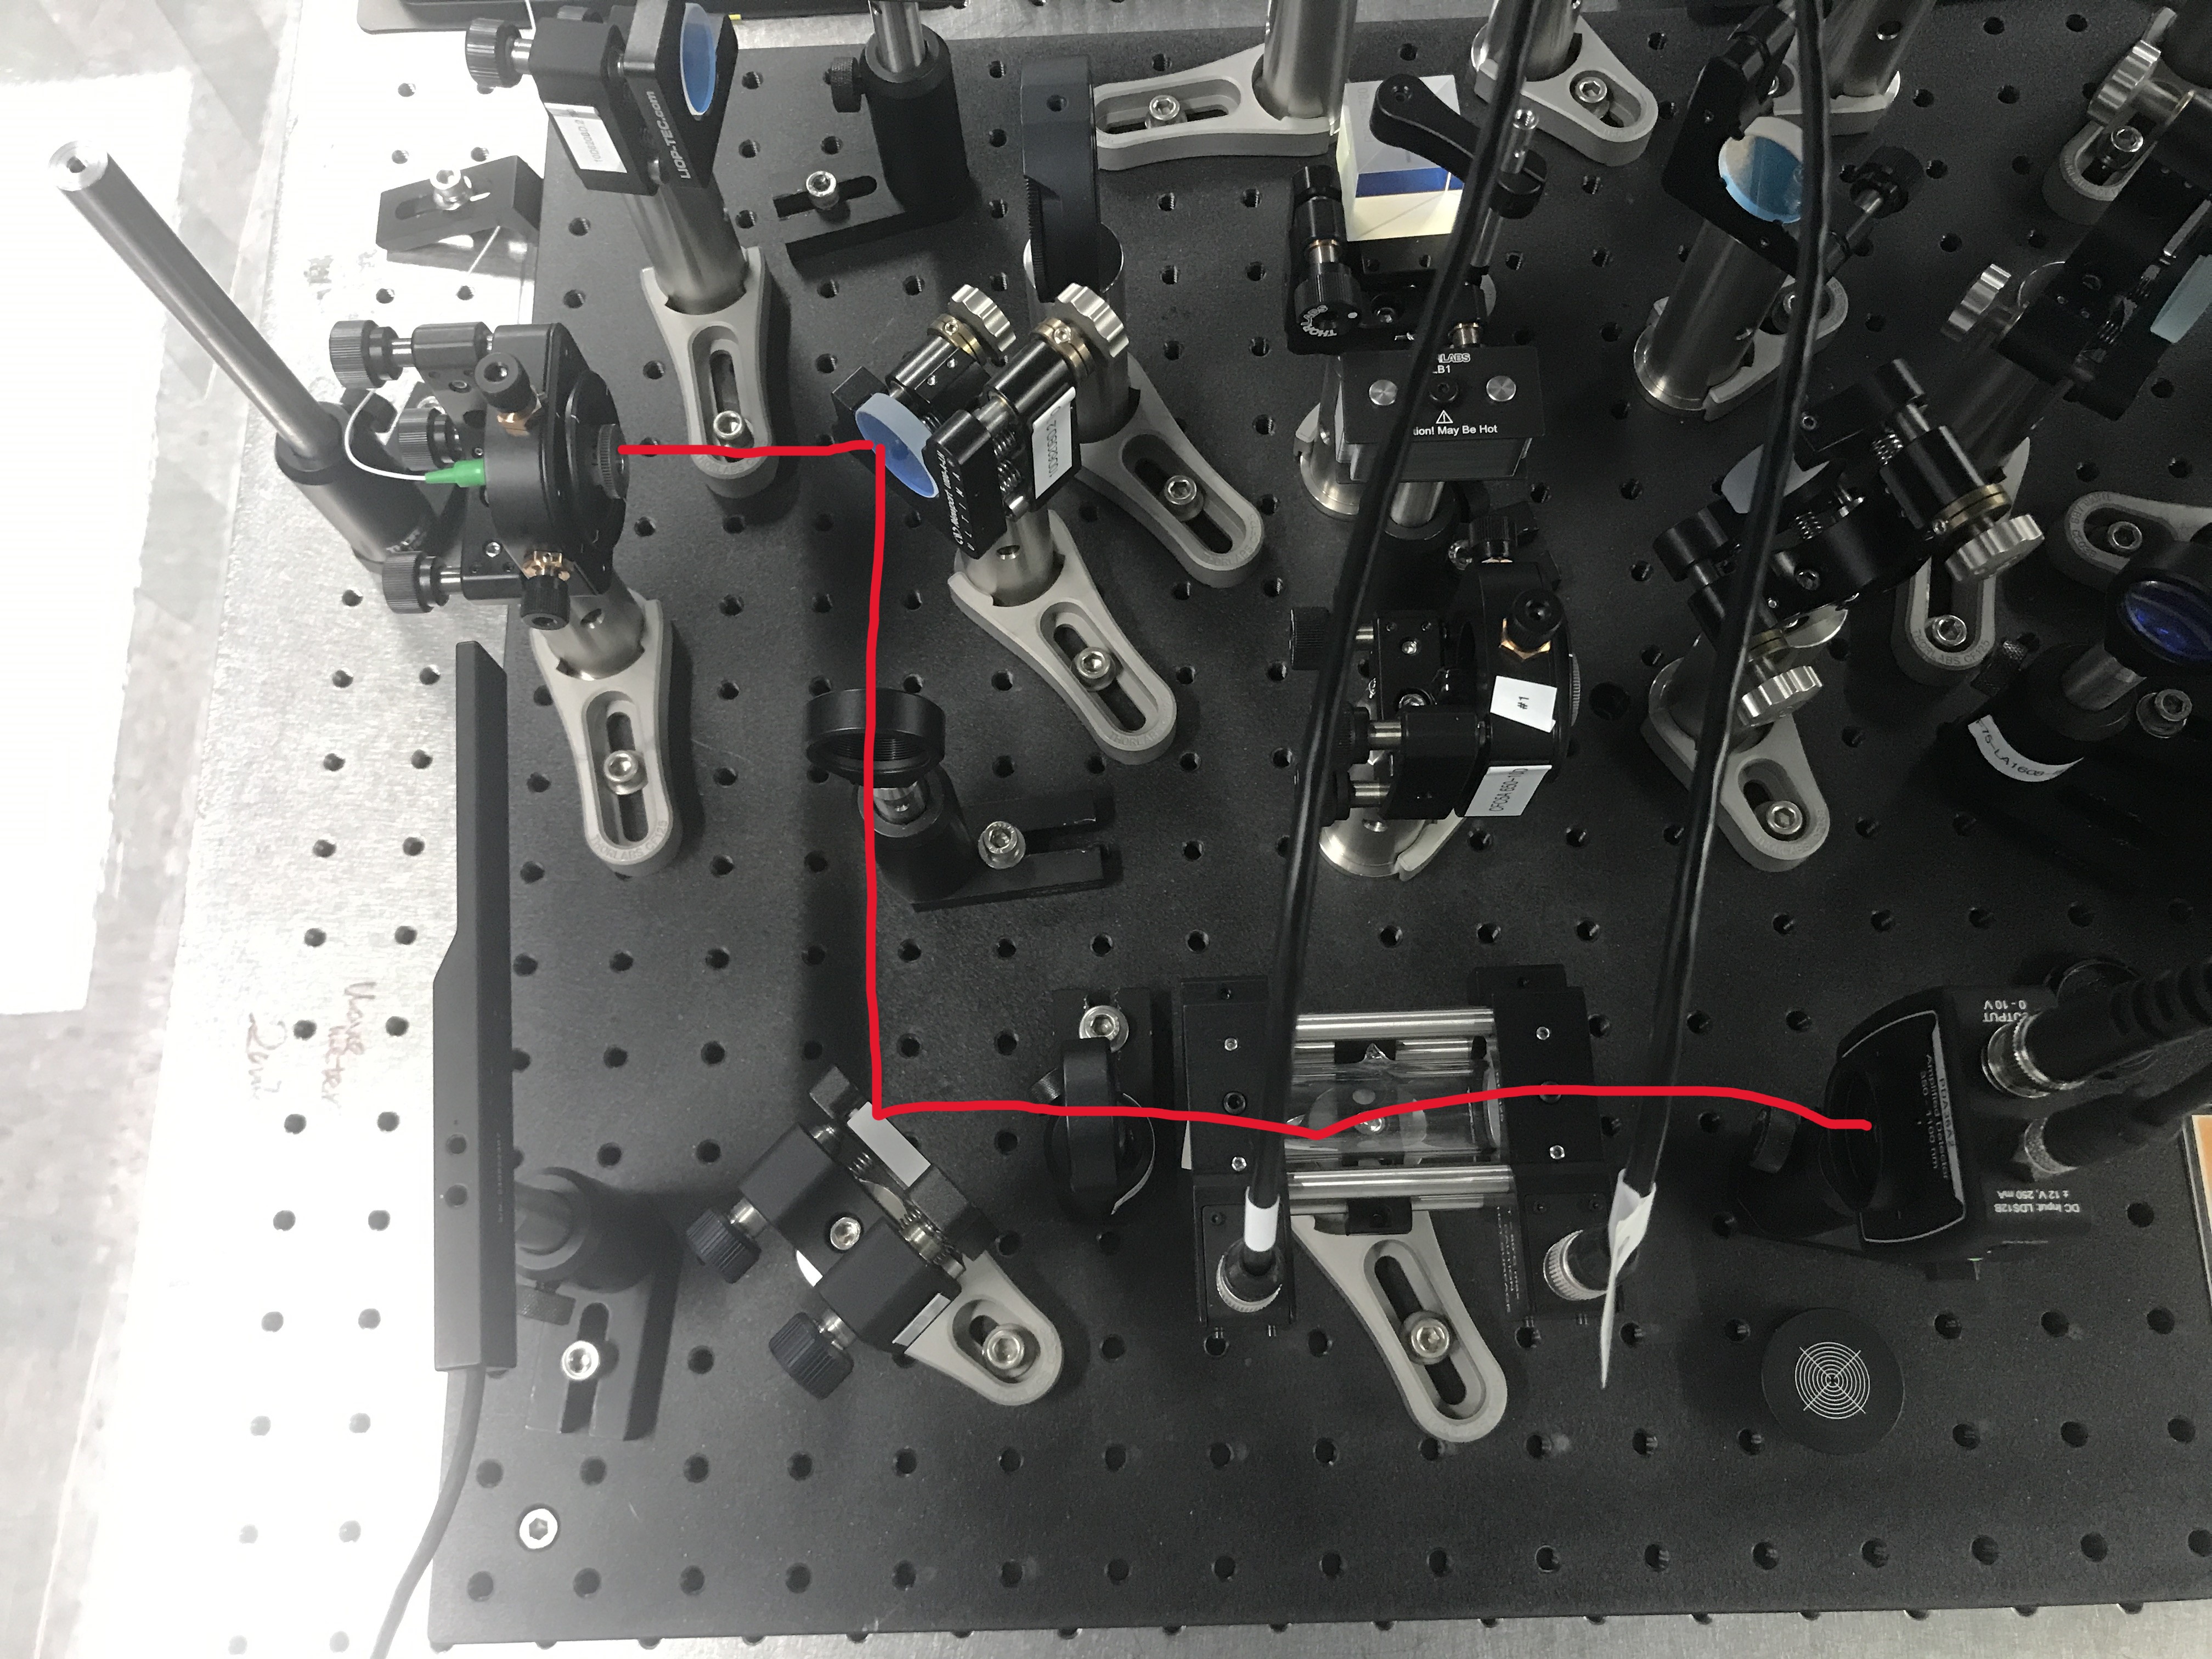
See picture of the setup for the measurements. I plan to do the same with a 75 mm lens for a more drastic difference in beam size. Before that, the laser output will be collimated using the fiber collimators at the point of the alser. Ideally, light exiting the laser would be collimated. This makes it easier to mode match the beam, which we will need to do eventually for the probe/pump.
Miscellaneous:
Connected CTL OUT of TED200C (laser temperature control) to input 3 of Moku (labelled Paige Bueckers). Must set the CTL OUT impedance of at least 10 kOhms from the TED200C manual, otherwise it will not register so on the Moku an impedance of 1 MOhm was set for the channel of CTL OUT input. This output is a voltage proportional to the actual temperature. The voltage range is 0 to 10 V with the conversion coefficient of 2 kOhms/V (using TH 20 K sensor). Using this signal instead of the previous triangular wave signal, which is more reflective of the actual temperature, did not solve the shifting issue: the frequency still has to be low to produce a not obvious shift. I thought this could be because of cable length differences between the CTL OUT BNC cable and the photodetector BNC cable, but probably not since electricity travels extremely fast. I also think that the temperature controller has asymmetry since cooling the laser may not have the same efficiency as heating it (this could be something with the PID controller of the laser temp controller).
I saw this page and thought it was interesting how a hot spot on the laser looks kind of like an inverted absorption dip. I didn't know lasers could do this- it probably shows up in the beam profile.