[Briana, Ian]
We want to see how the laser power and the vapor cell temperature affect the strength of the absorption dip (the length of the dip). We want to first get as many atoms into the "ground state" for the 780 nm transition (5s 1/2) by heating the vapor cell. Then, we want to tune the laser power by changing laser current to excite as many atoms as possible into the 5P 3/2 transition state. This can maximize the strength of our absorption dip.
On 7/16: For each vapor cell temperature (25, 30, 40 Celsius), a temperature scan was taken for currents of 100, 110, 120, 125, 130, 135, and 140 mA. The sawtooth signal (100% symmetry) was used to scan across the laser temperature (which changes the wavelength output by the laser), but this caused some overlapping absorption dips due to the sudden signal drop causing the temperature to pass through the absorption dip again (this is apparent as seen here sawtooth_issues.pdf). So, this measurement was redone on 7/17 with a triangular wave, which has smooth continuous temperature shifts. We also measured the power output by the laser at each current/vapor cell temperature, data is here for both days of data.
On 7/17: For each vapor cell temperature (25, 40 Celsius), a temperature scan was taken for currents of 110, 120, 125, 130, and 135 mA. A slower scan frequency (10 mHz) was used to ensure the temperature shift (shown to occur in the previous post) was not the same. To elaborate, from the last post there was a shift in the absorption dip along the temperature axis depending on whether the triangular wave signal at the absorption dip had a positive or negative derivative. This is most likely beause of response time delays, which cause slight asymmetry along the signal. At low frequencies the dips overlap properly but at higher frequencies (>50 mHz), shifting occurs (see whyisthereashift for results). Anyways, for some reason, the transmission started saturating and becoming noisy at 135 mA. The photodetector used to measure power was the same and measured 10.91 (on 7/16), 10.60 mW (on 7/17) for 135 mA at 25 degrees Celsius. I checked the specs of the photodetector and it can only read up to 5V for 50 Ohm impedance, which is what we are applying. We had no gain and the settings from the Moku were all the same, but I could be missing something. I also wonder if the photodetector was misaligned.
Plotting the absolute dip strengths of these dips from both days shows an increasing absorption dip strength with vapor cell temperature (comparisons between vapor cell temperature (25, 30 and 40 Celsius) from 7/16 and 7/17 data are here: dipdepth.pdf), suggesting we are starting to pack the atoms into the S 1/2 state. From those graphs, the maximum absolute dip depth occurs around 125-130 mA (corresponding to 9-10 mW of laser power, as measured by the red photodetector). I think it makes sense to plot the absolute dip depth since that informs you of the amount of photons absorbed. As pointed out during the meeting, it's a bit strange that the absolute dip depth decreases upon saturation (would expect it to plateau), but I think this can be attributed to the detector being unable to distinguish changes in intensity at some limit, causing noise and loss of resolution.
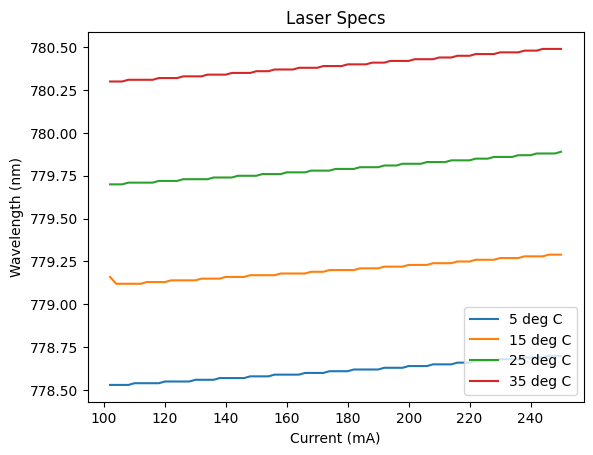
Plots from 7/16 data on the absorption dips with temperature on the x axis are here 7_16_24temperature.pdf). Based on our laser spec sheet data (full excel file here, scanned datasheet here), increasing laser current or laser temperature increases laser wavelength. So, the absorption dip occurs at lower temperatures as you increase the current, which can be explained by the wavelength increase from current increasing being offset by the decreased temperature (corresponding to decreasing wavelength).
When we plot these temperature axis graphs in wavelength space (wavelength_absorption.pdf), we confirm that the values are reasonably close to the 780 nm transition. Offsets and patterns in the location of absorption are because of systematic calibration errors since conversion from temperature to wavelength was done through linear interpolation with the laser specs. This is all under the assumption that the output of the laser matches specs accurately. From our own measurements, there is obviously offset in power/temperature so overall these numbers are a rough estimate.
Daniel measured a splitting of 6.8 GHz using graphs in the last post and I measured a splitting of 6.3 GHz from one dataset (from 7/17, with vapor cell of 25 deg Celsius). From the very initial estimate, I would guess that the transitions correspond to the F=1 (S_1/2 orbital) to the F=0 (P_3/2 orbital) and F=2 (S_1/2 orbital) to the F=3 (P_3/2 orbital) for the main and smaller dip, respectively. I calculated this by finding the average of the wavelength difference between the small dip and big dip. Then, I subtracted different possible hyperfine transitions between the S 1/2 and P 3/2 states (with selection rules being that deltaF = 0 or +/- 1) to see which one best matches the relative wavelength difference from data. This one dataset just happened to correspond to the above guess. A notebook showing these calculations is attached here: Hyperfineenergies.ipynb. Rb transitions found used found here (specific image used is rb_transition.png). Code will be uploaded to Gitlab. All data is in NextCloud under Users/briana.
Used oscilliscope mode to take data because data logger took too long for too little reward (files too large and low resolution). Assembled the other photodetector. We've been using the one labelled McCuller Lab for these measurements. We also assembled the now free-space EOM (see attached datasheet). We will need other lenses to focus the beam onto the 2mm aperture of the EOM (see updated schematic).