[Briana, Ian]
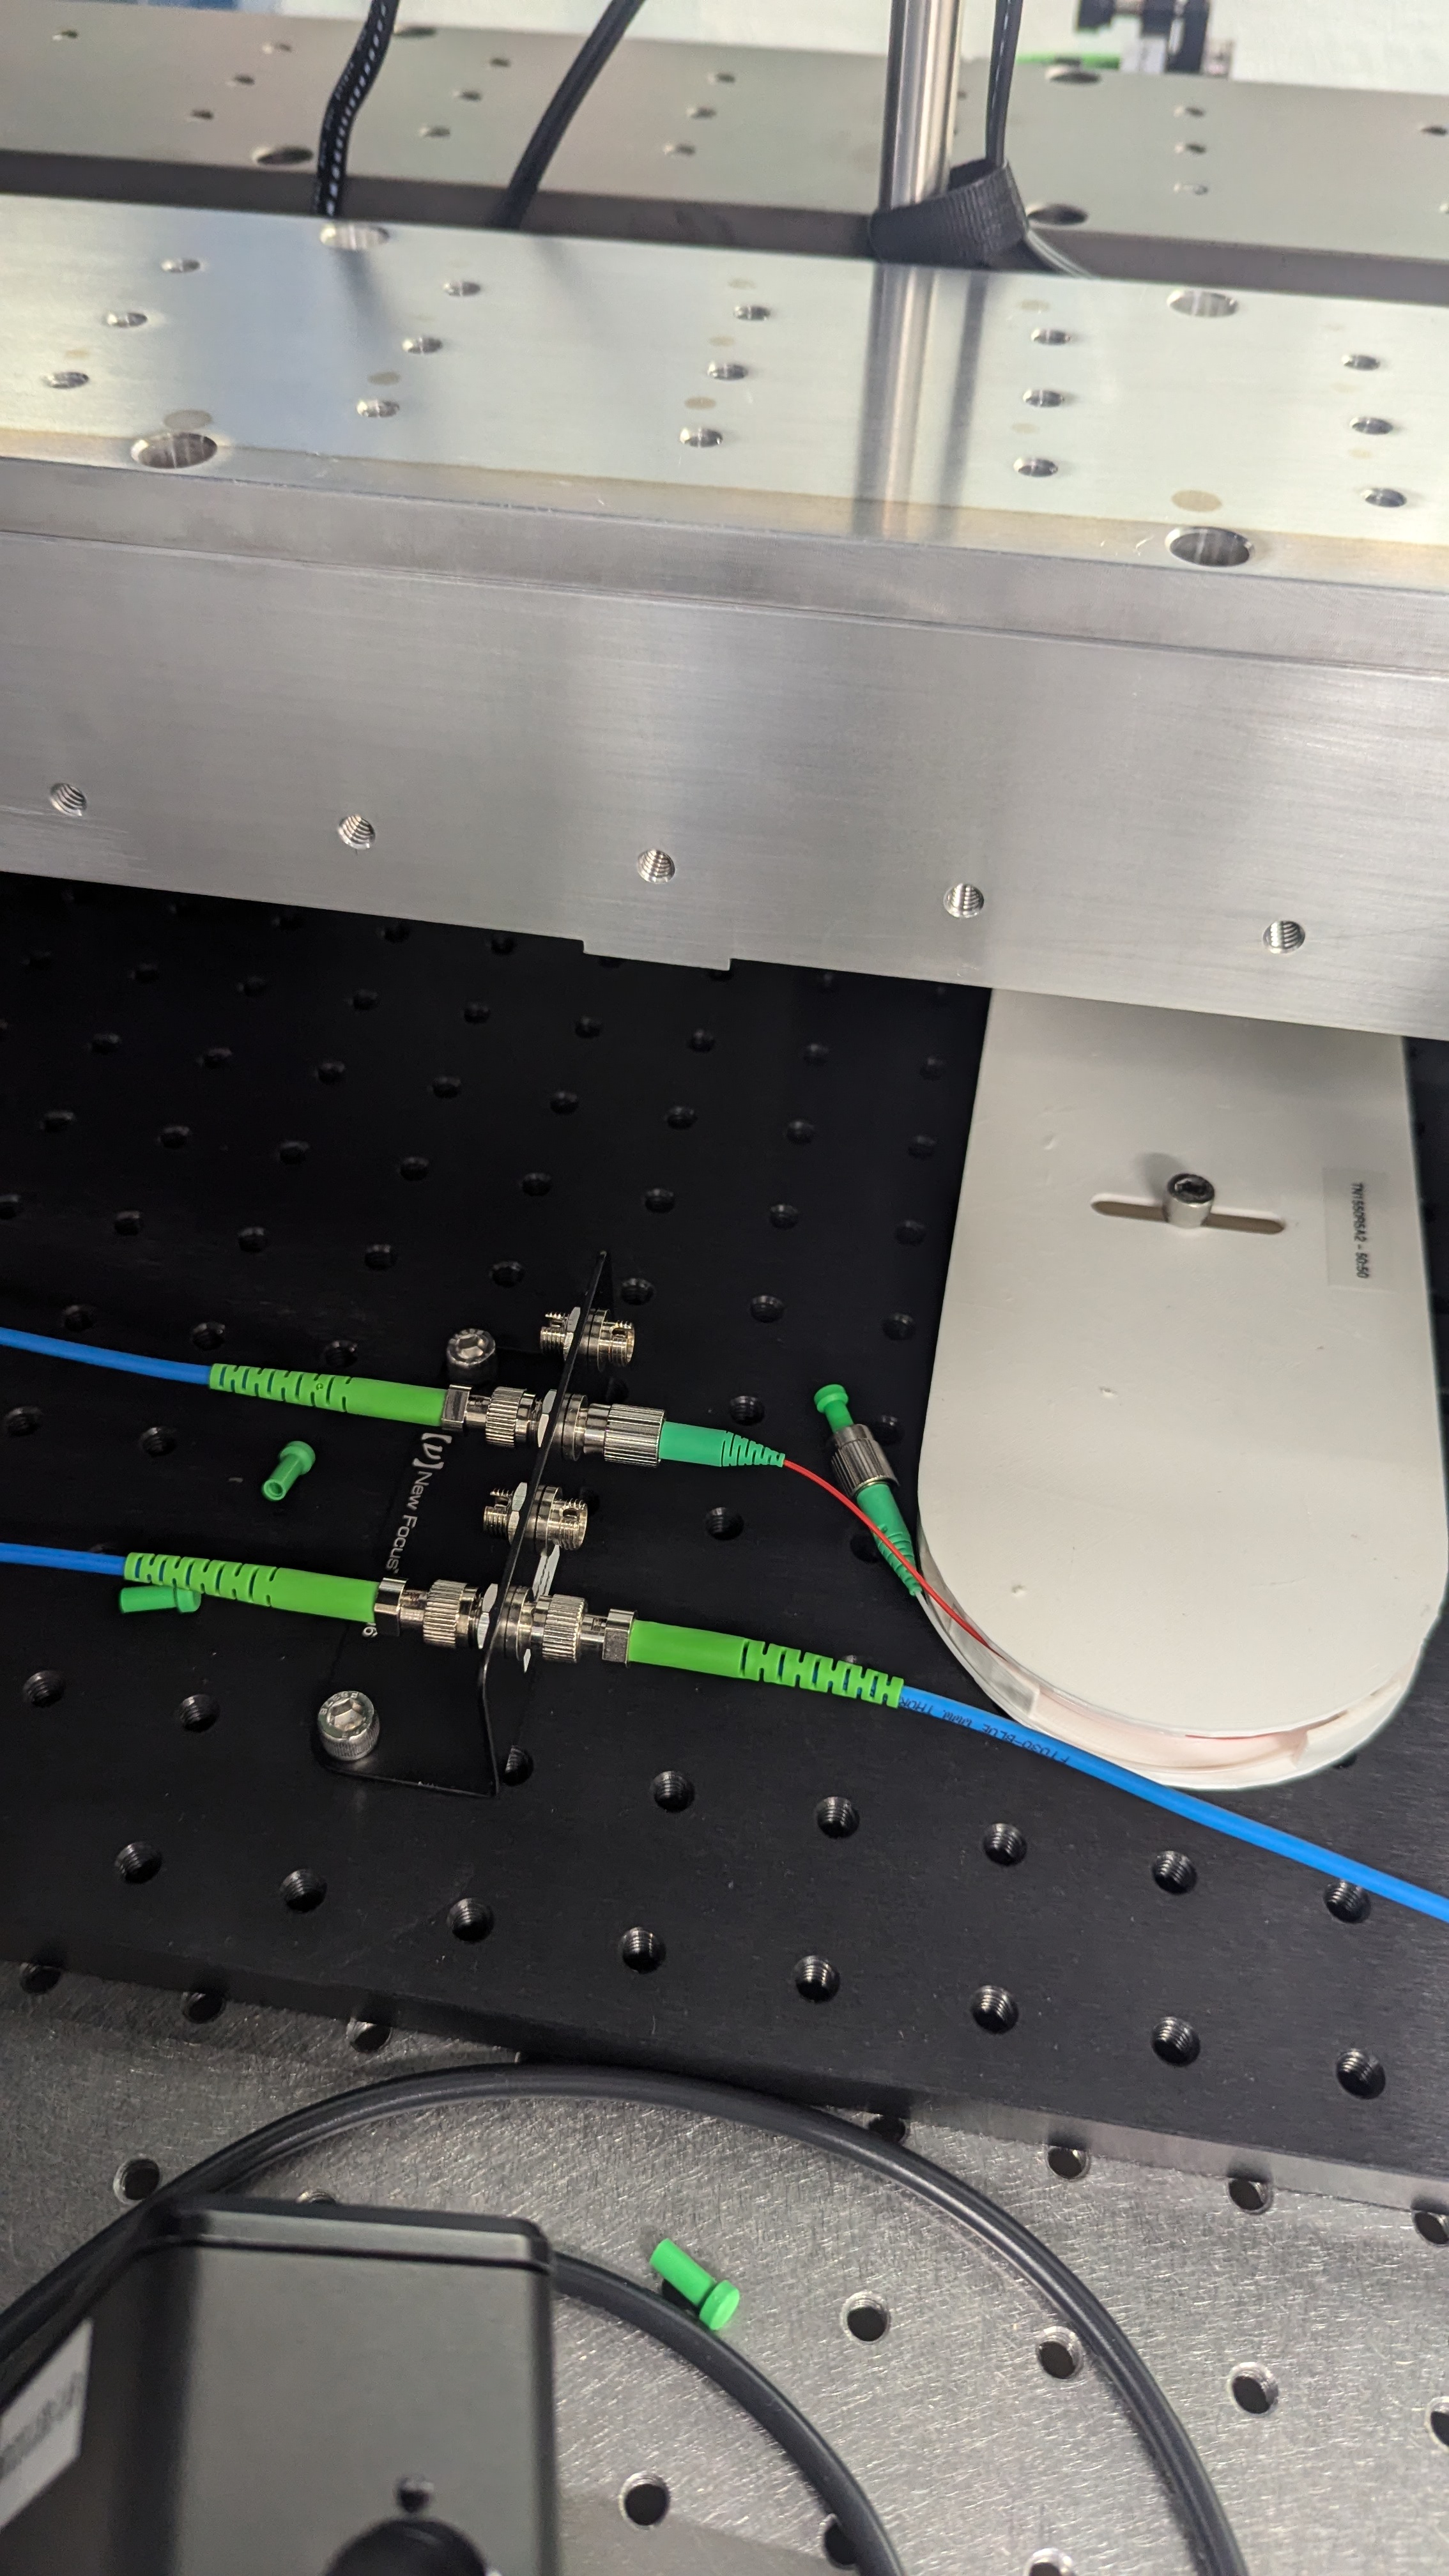
The polarizing beam splitter currently in use has typically >98% retention of power ((transmission + reflection) / incoming power). The transmission effiencies varied from 87% to 95%, which I think is a result of the transmittance through the cube changing rapidly (on the order of 0.1 mW). Torrey found that moving/heating the fiber changes the power reading (transmittance) significantly, even though the fiber of the laser specs are supposedly polarization maintaining fibers. Changing the temperature/current of the laser does not change the stability of this reading. We are going to take a measurement overnight of the transmission through the beamsplitter (p-polarization) to measure the drift in power as a result of changing polarization from the laser fiber. There may be slight shifts at the beginning because I changed the settings to 82.96 mA (current) and 9.924 kOhms (temperature) before leaving. I need to read more but I'm pretty sure this is a result of our laser not aligning with the slow polarization axis. I'll elaborate once I read more and actually understand it.
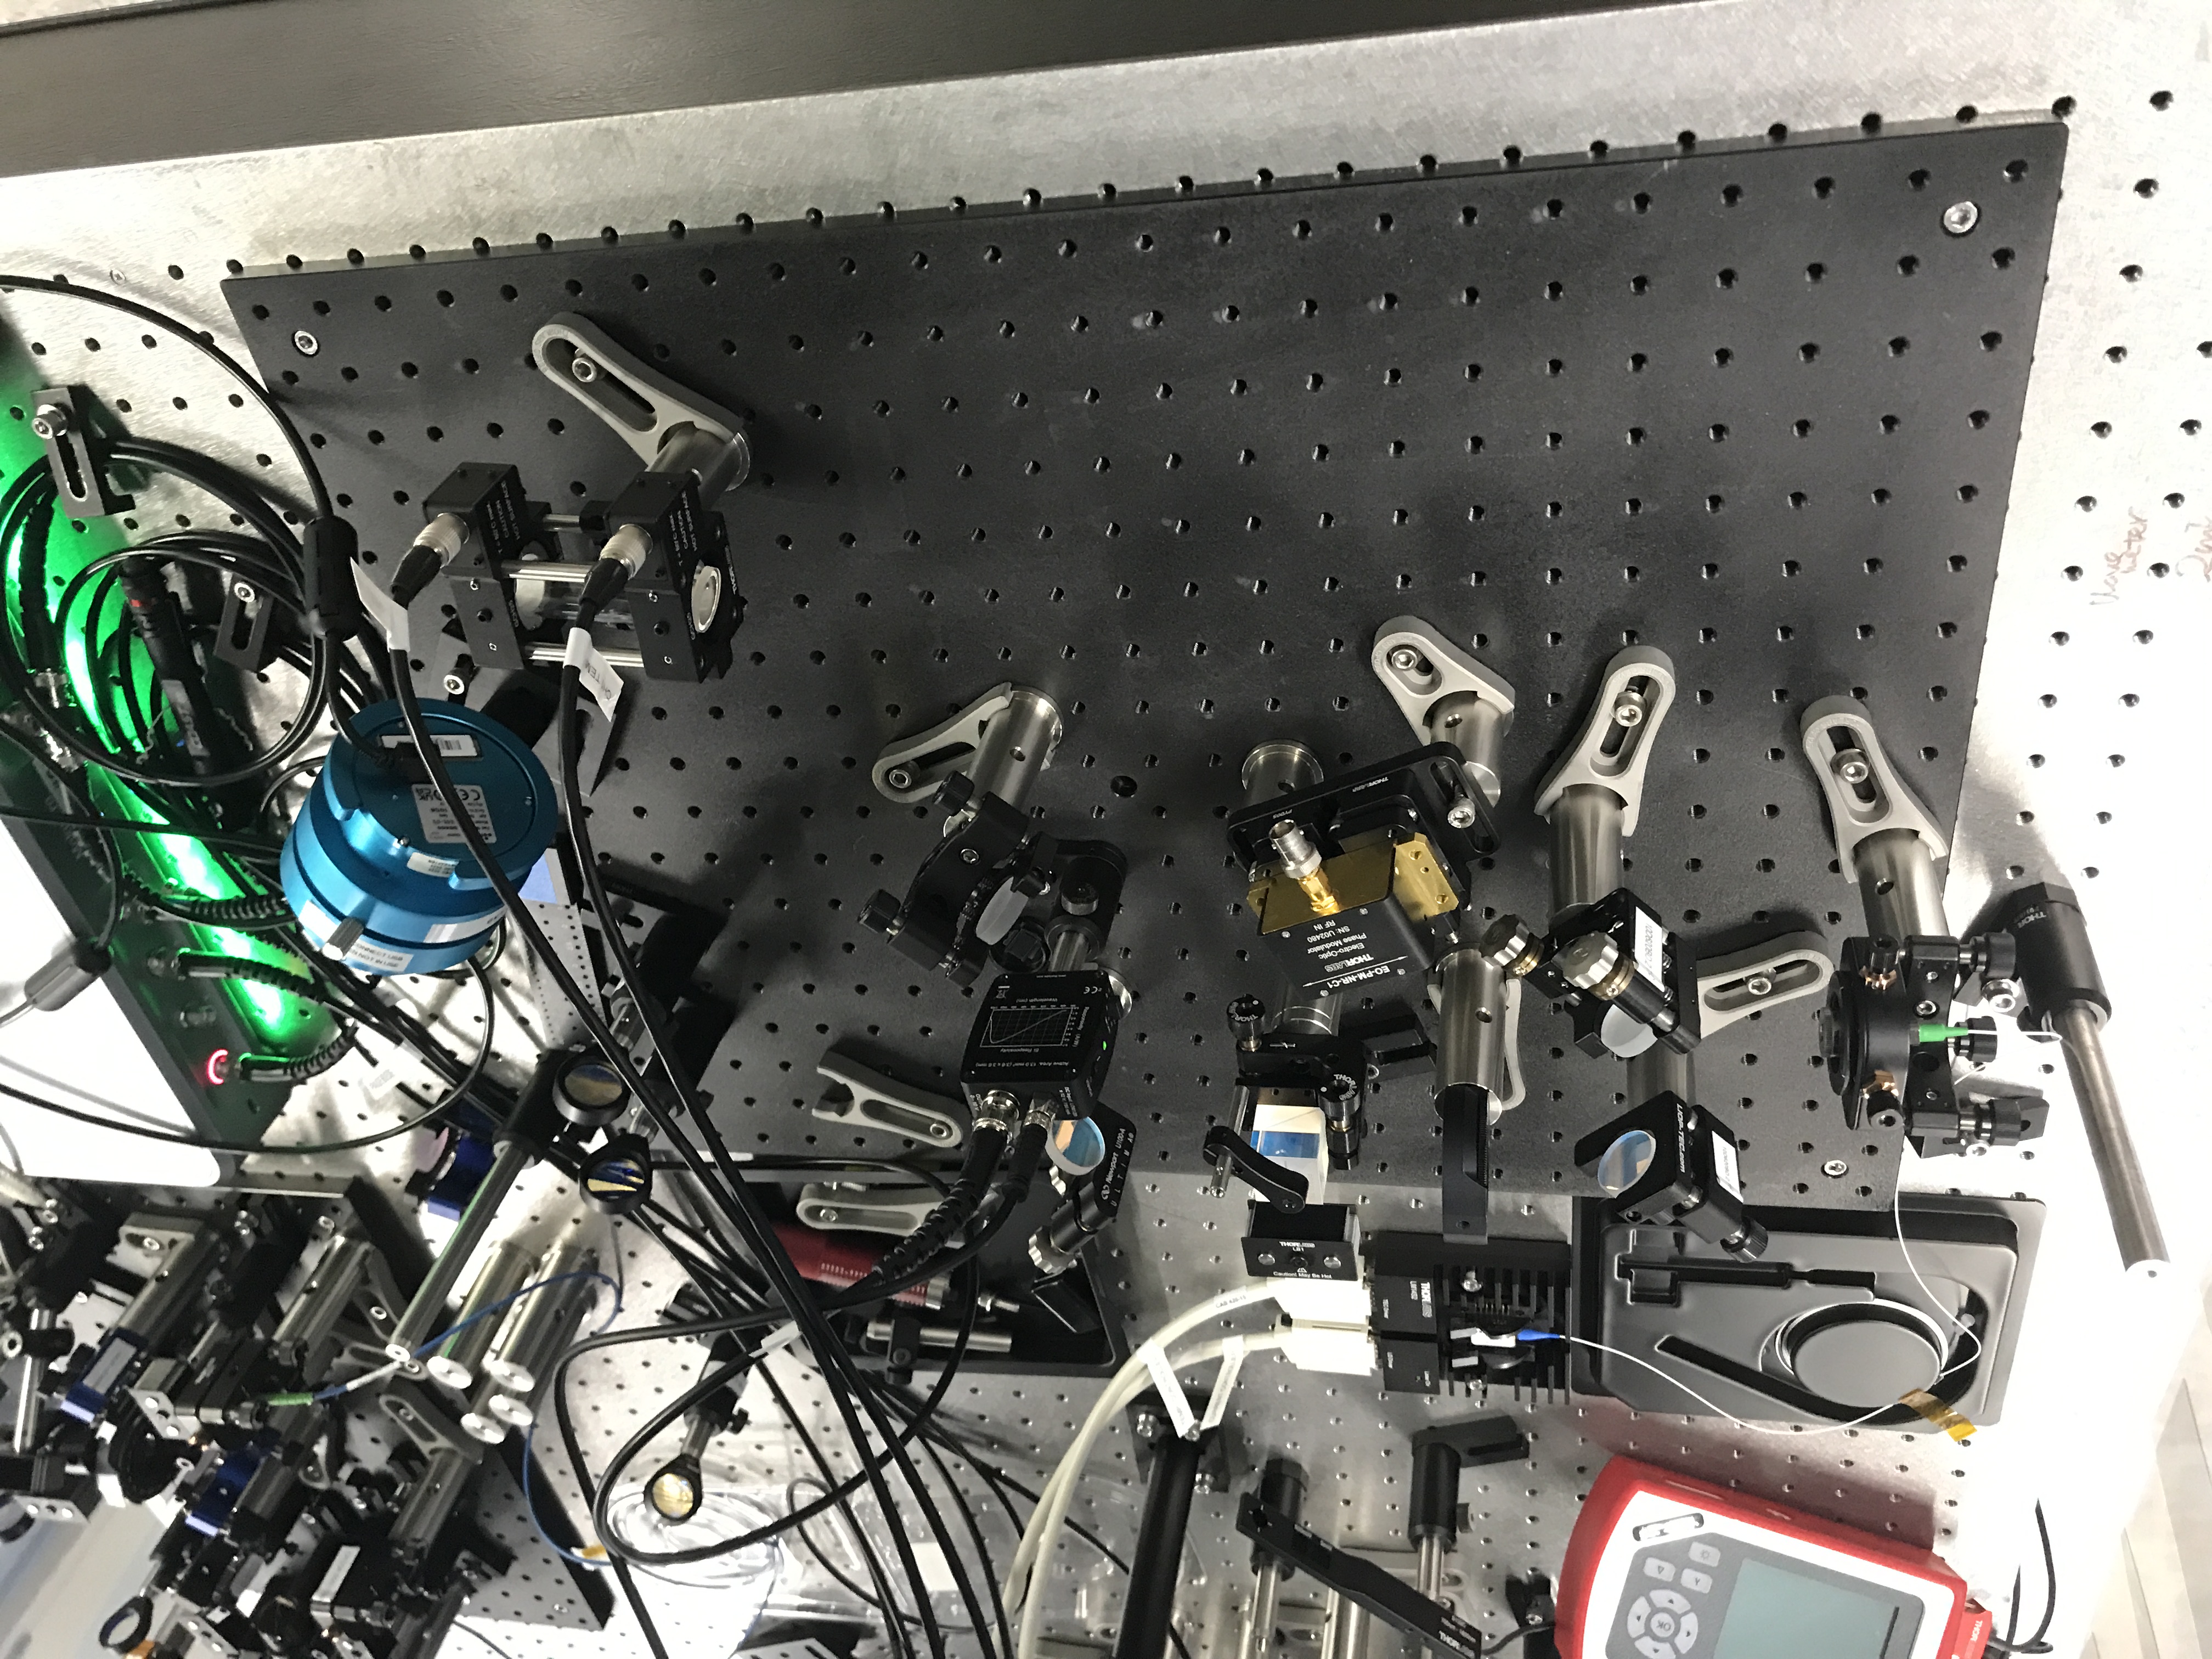
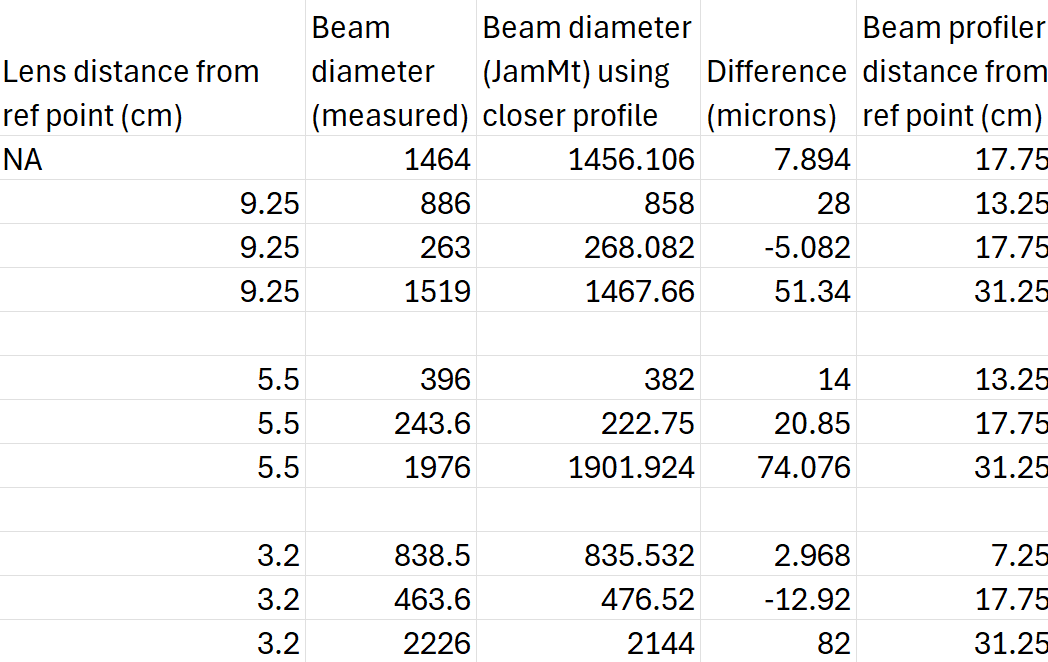
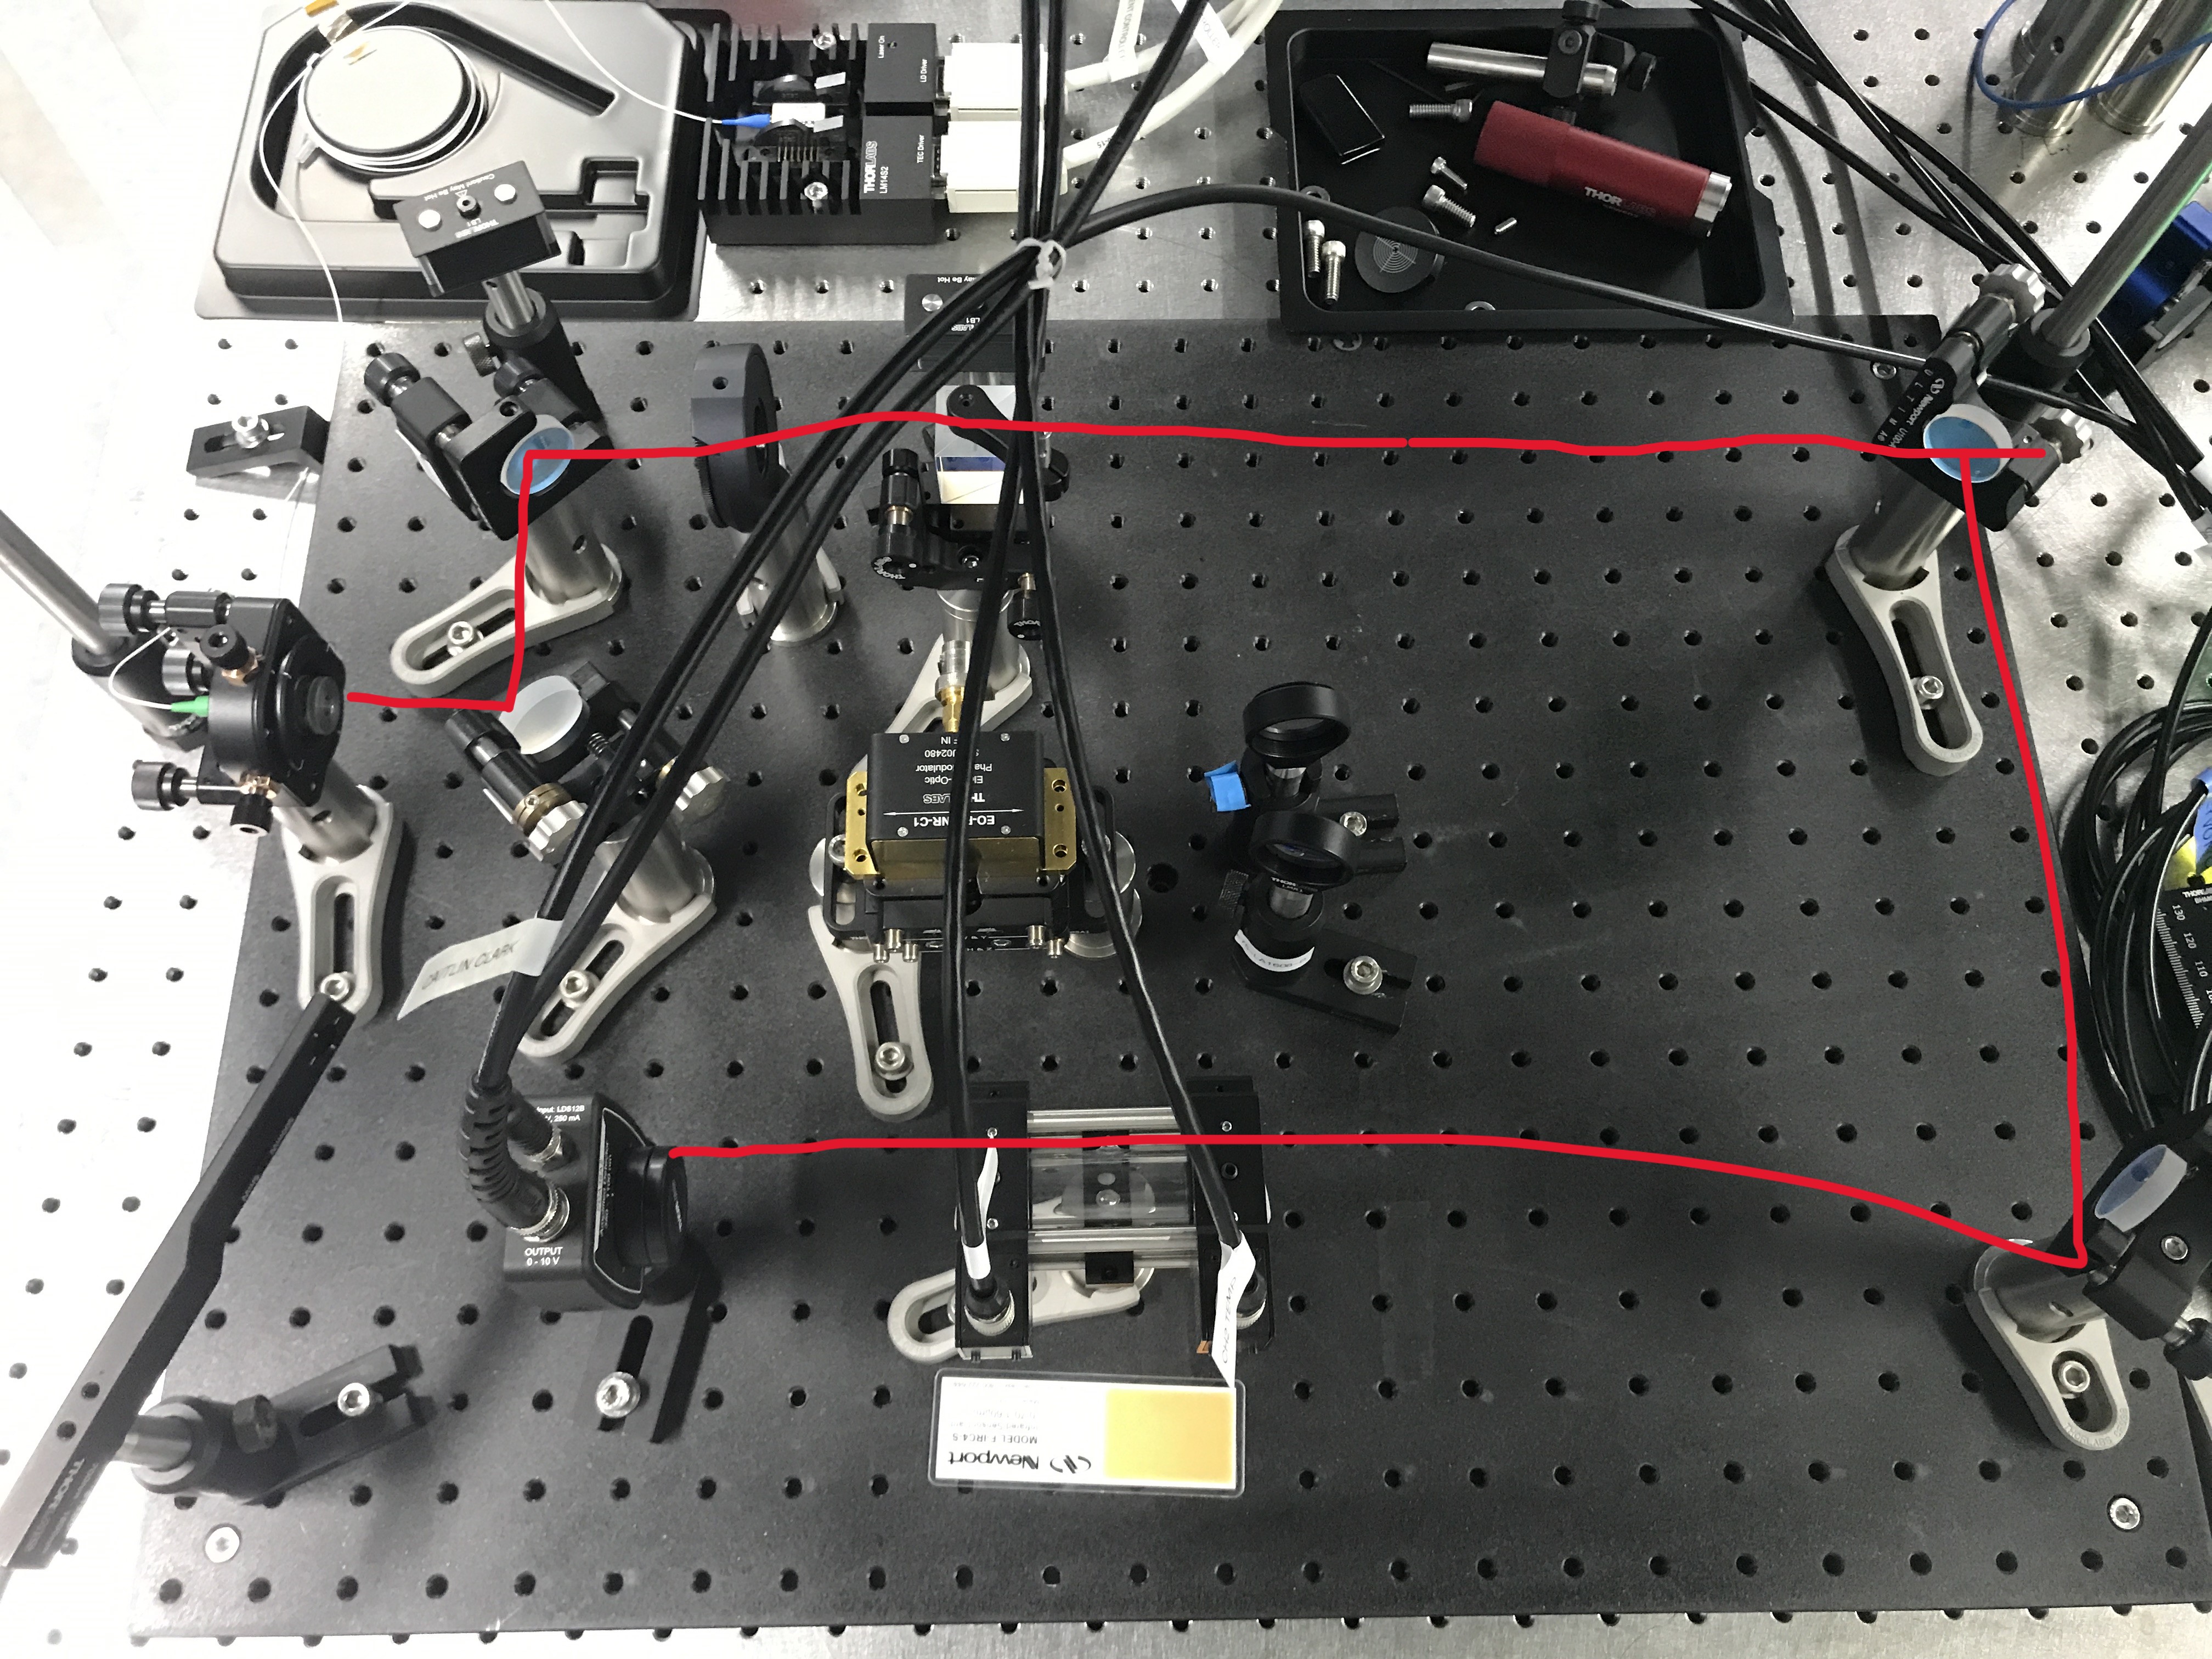
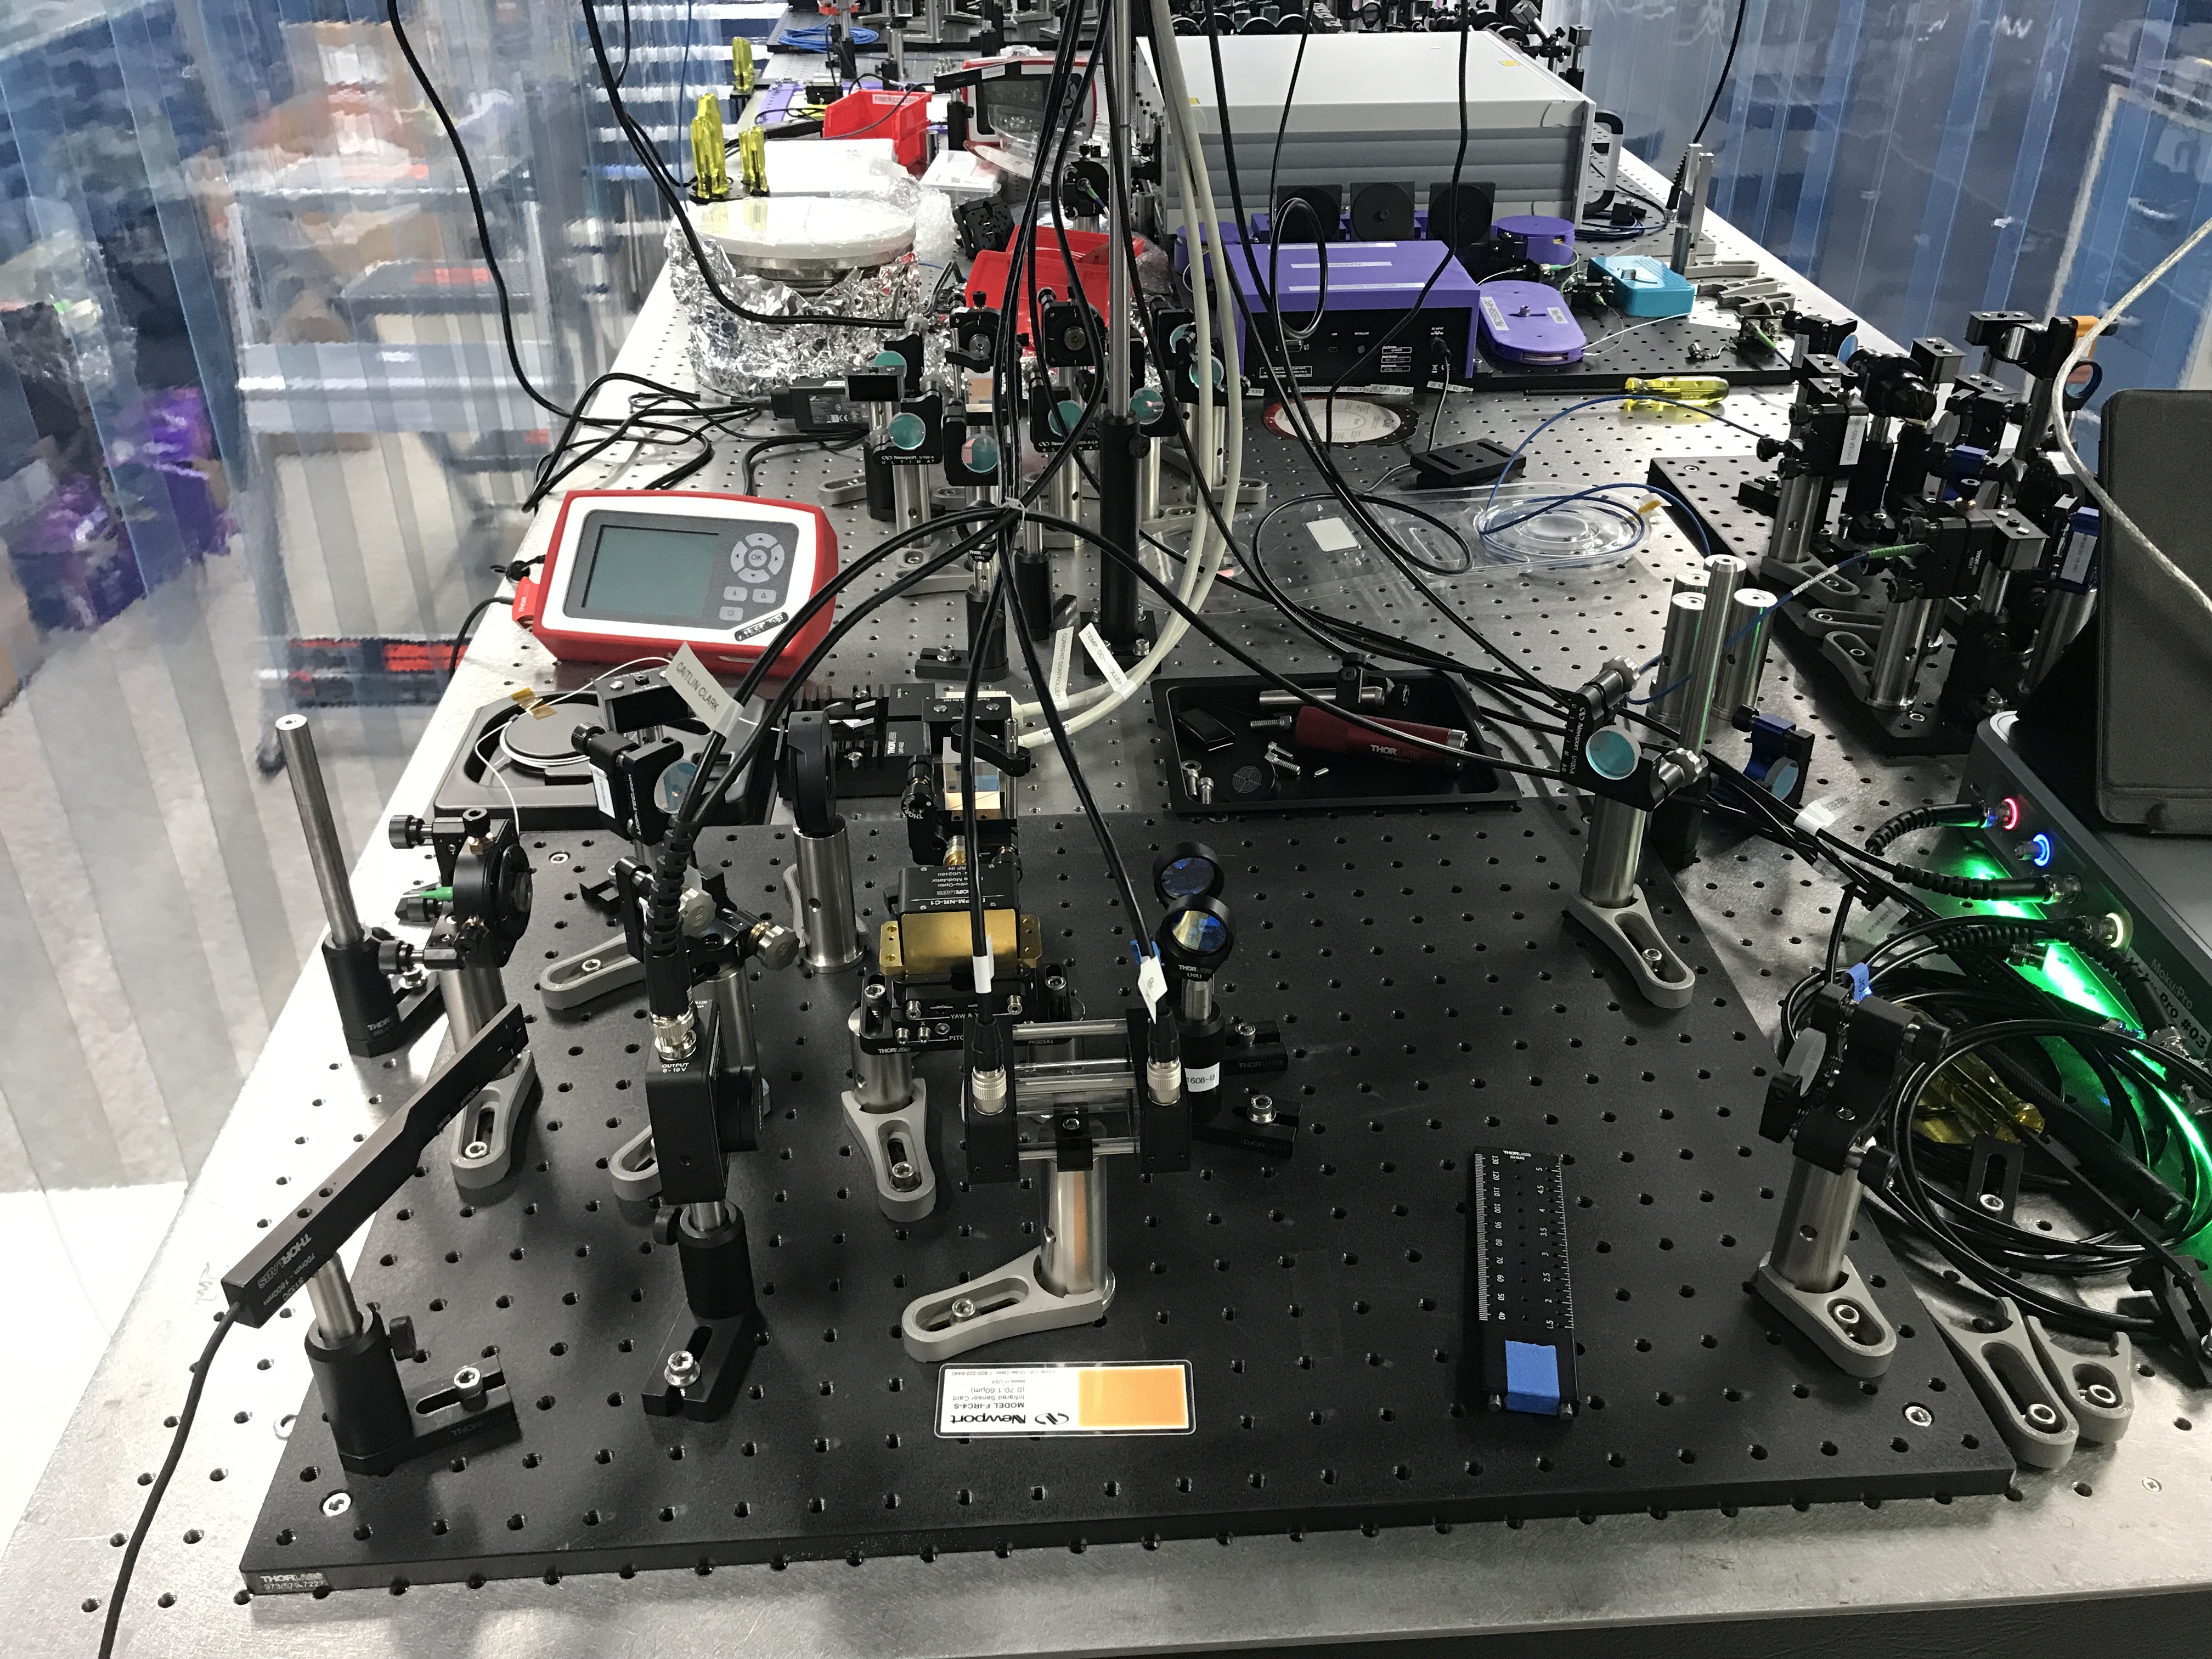
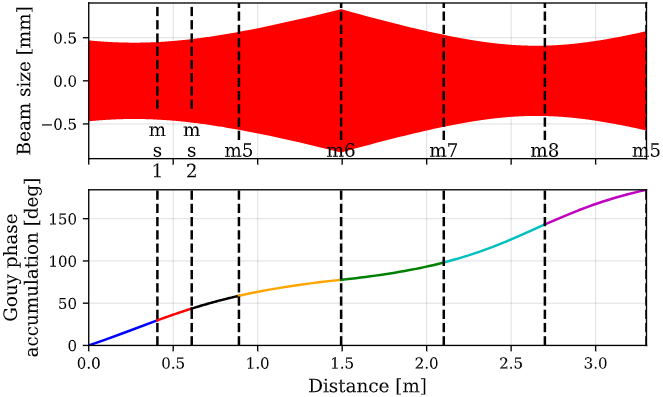
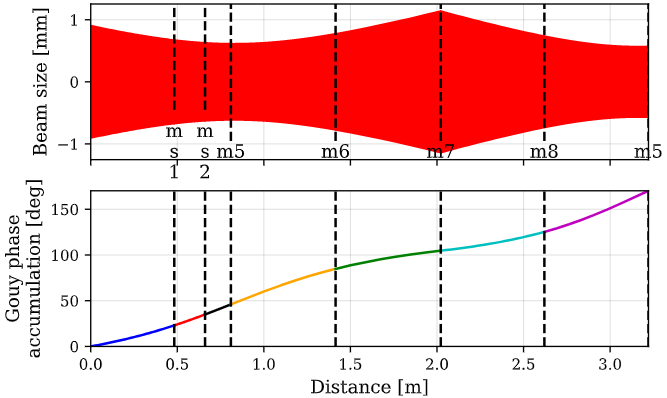
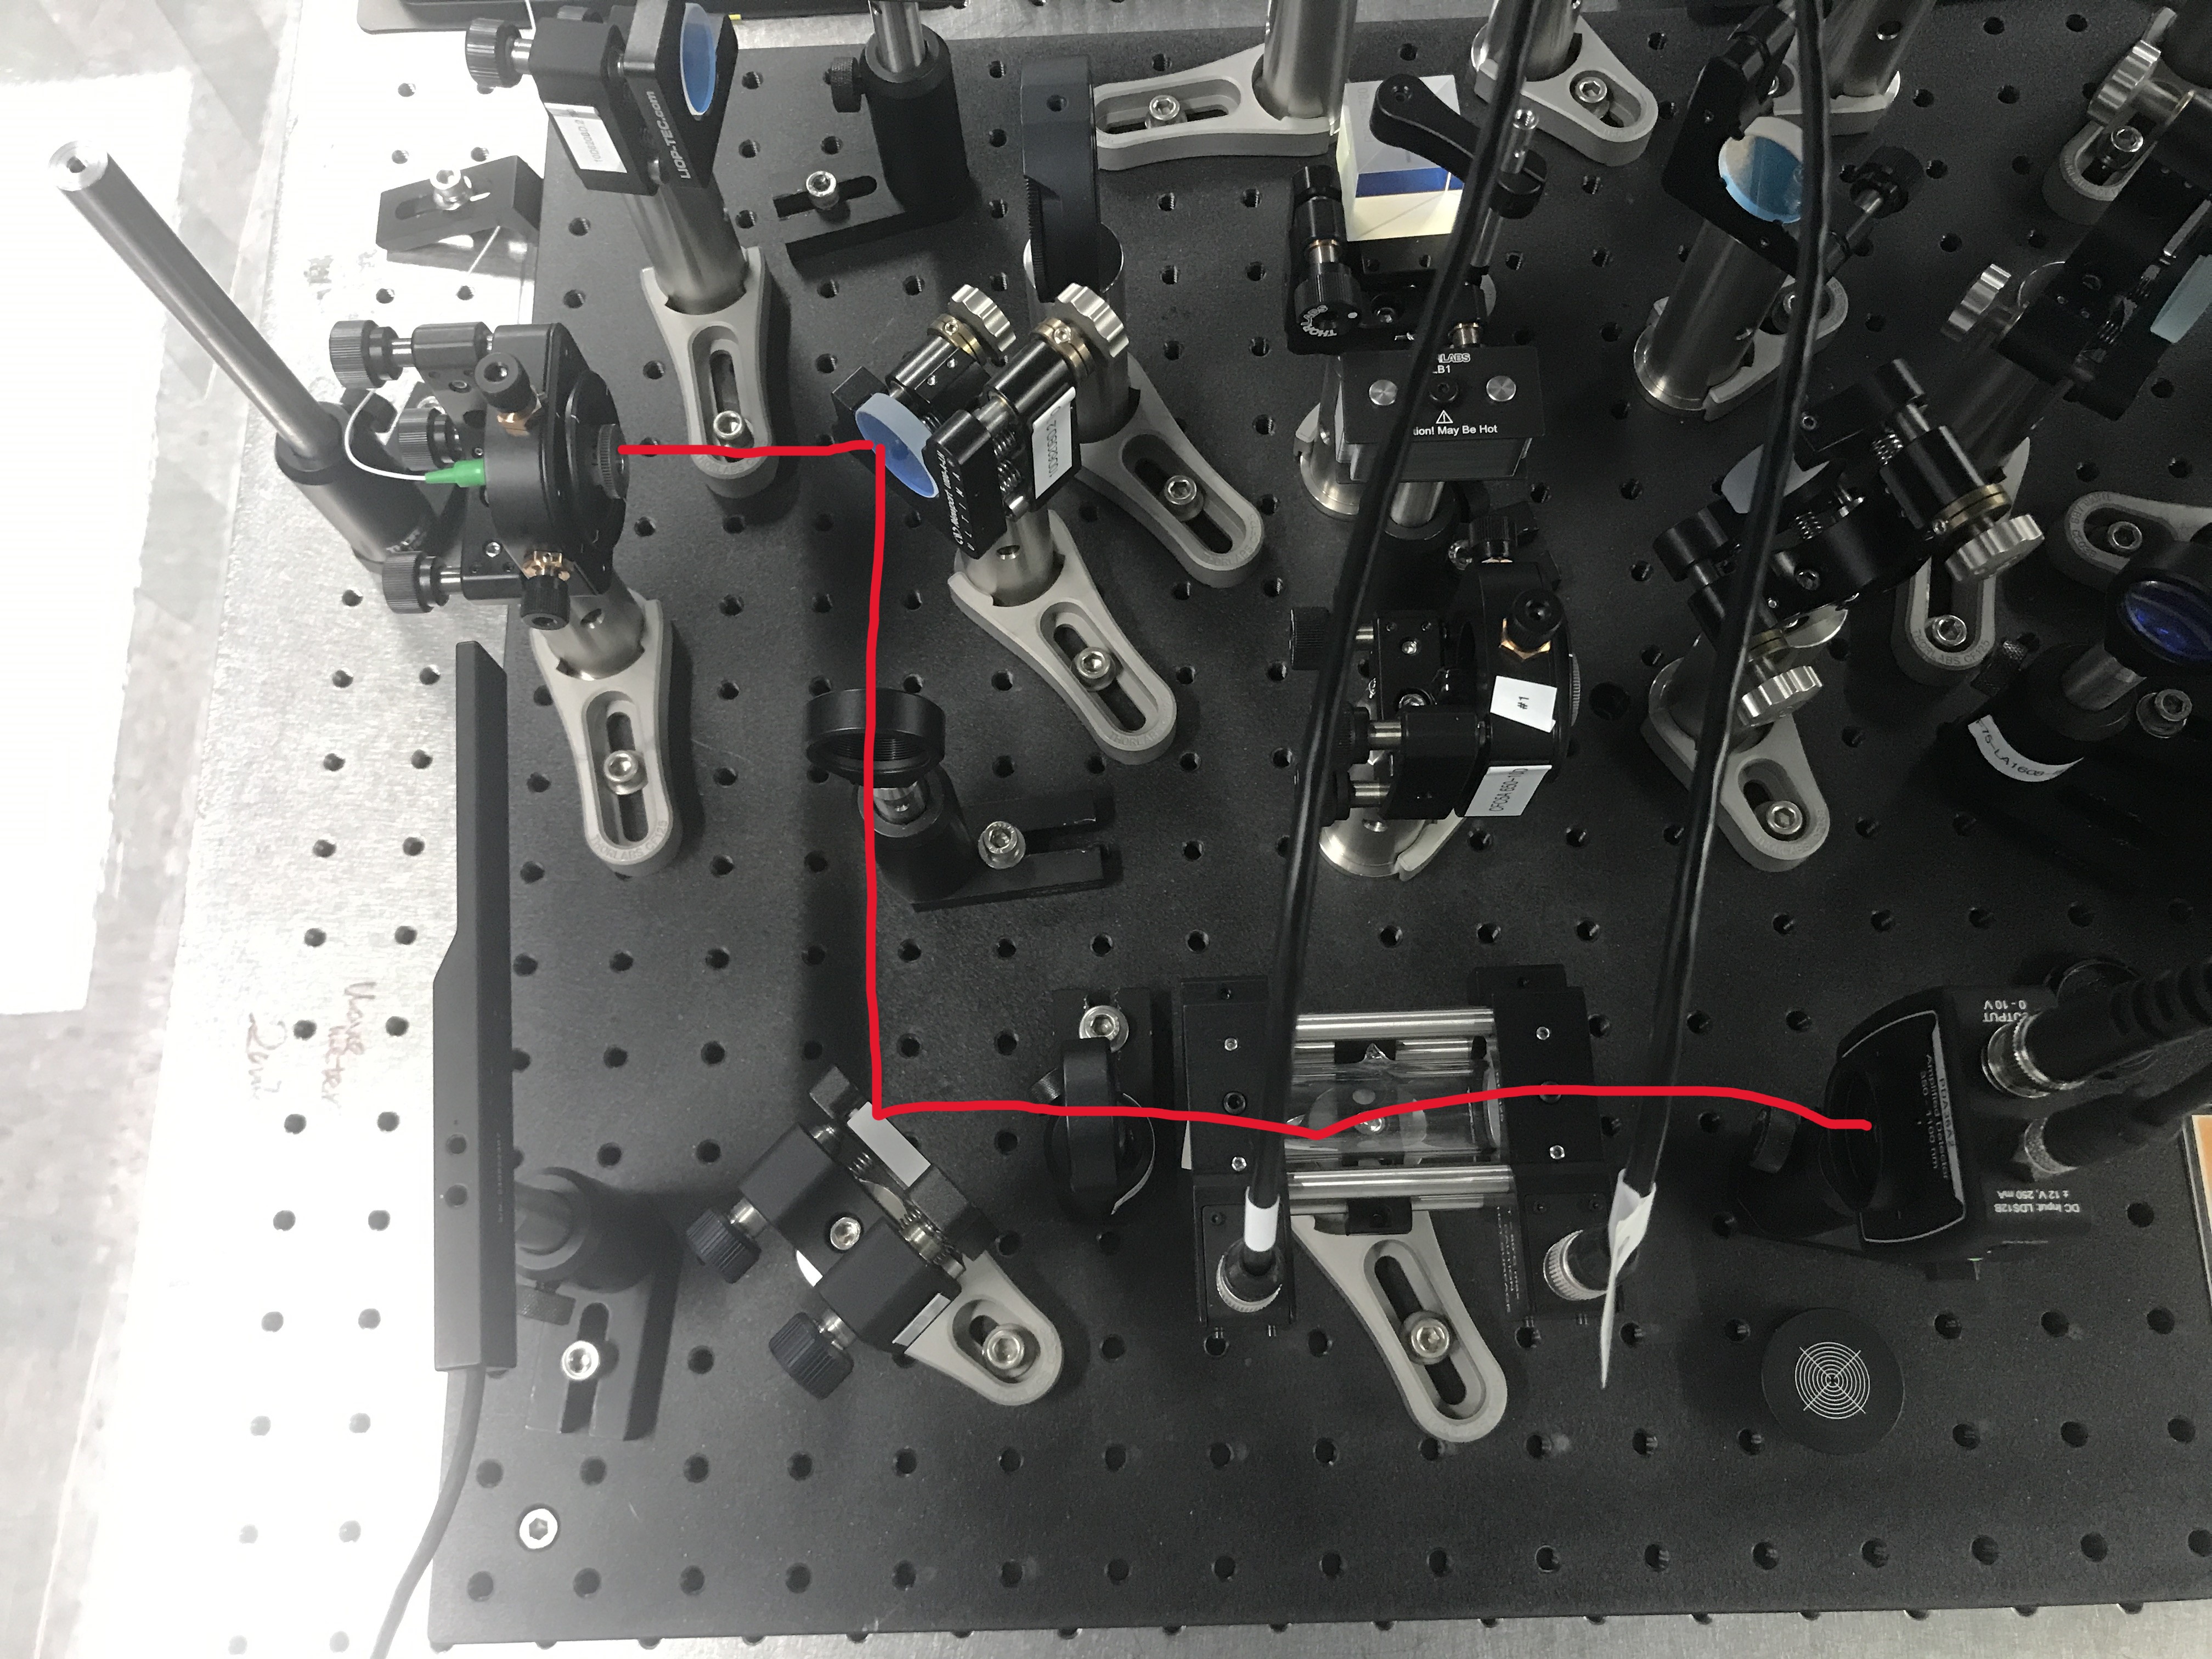
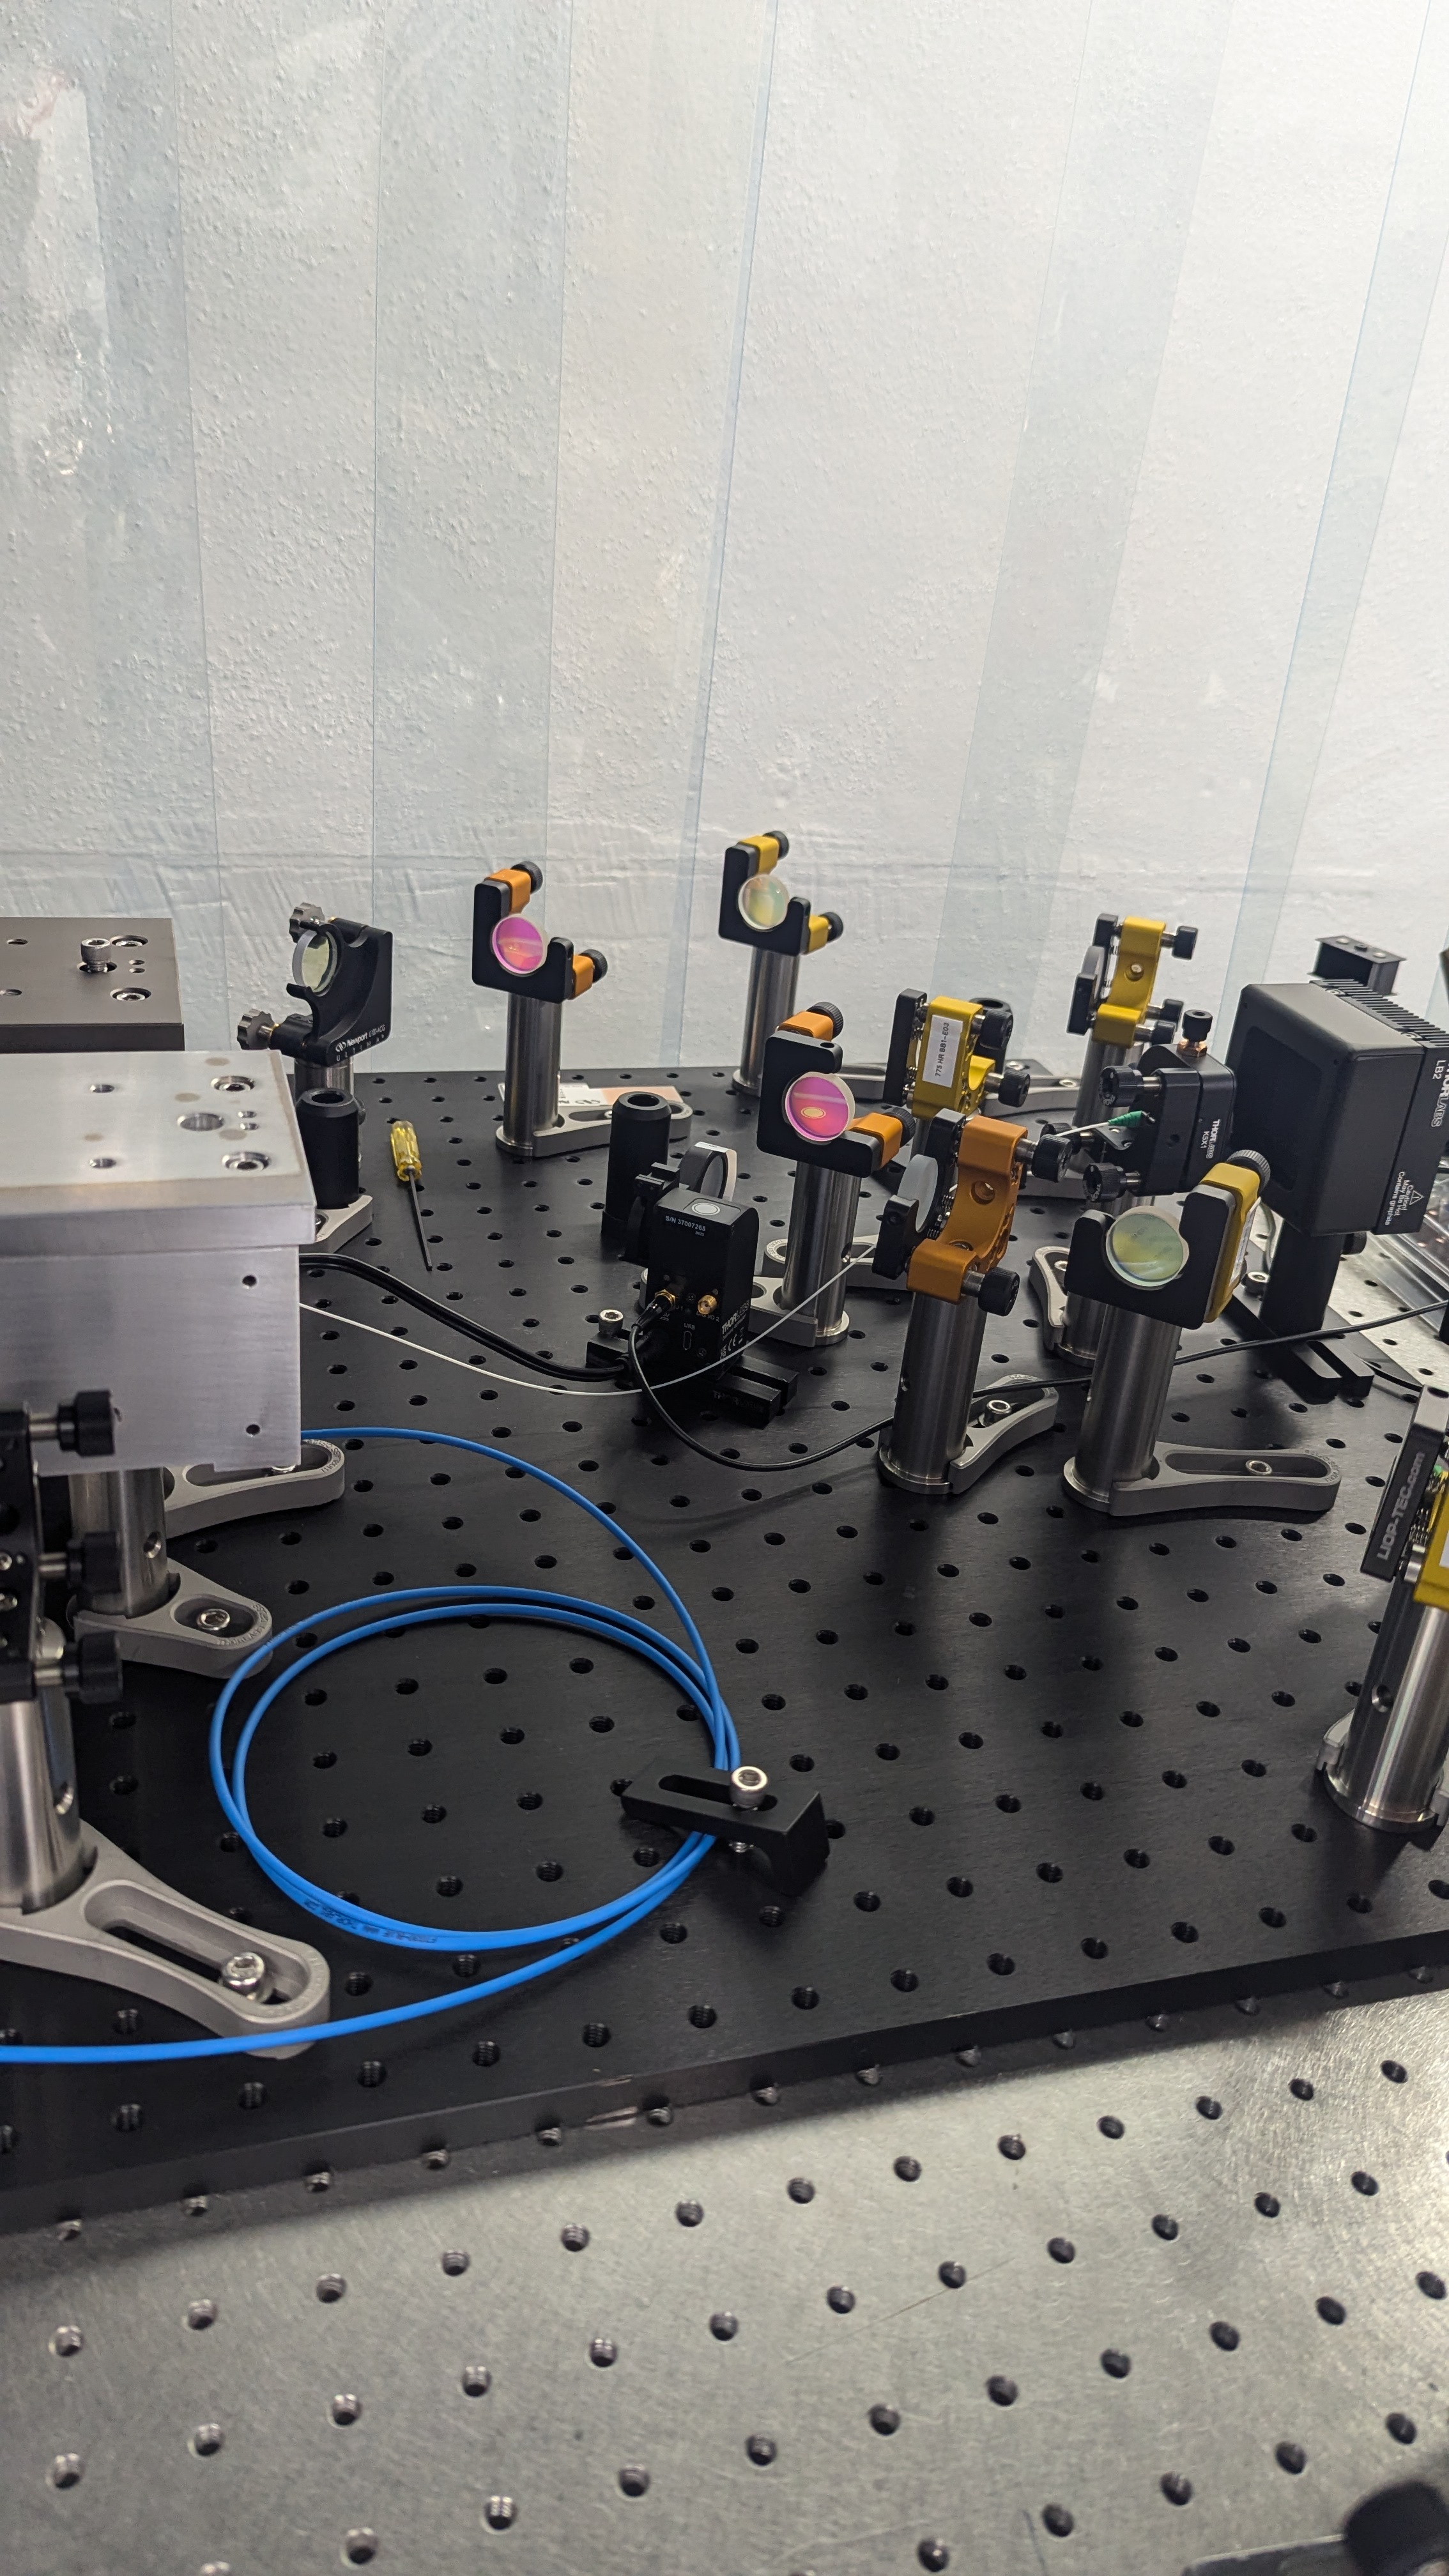
I beam profiled from the lower right mirror (see setup from last post) at 123.88 mA, 7.445 kOhms (these values shouldn't change the beam profile but just as a note). JamMt finally matches with the measured beam profile, with and without lenses (exampleJammtcomparison)! I think it was a combination of inaccurate distance measurements (I was counting holes- using a tape measure helped a lot) and not enough data points that caused issues for me previously.
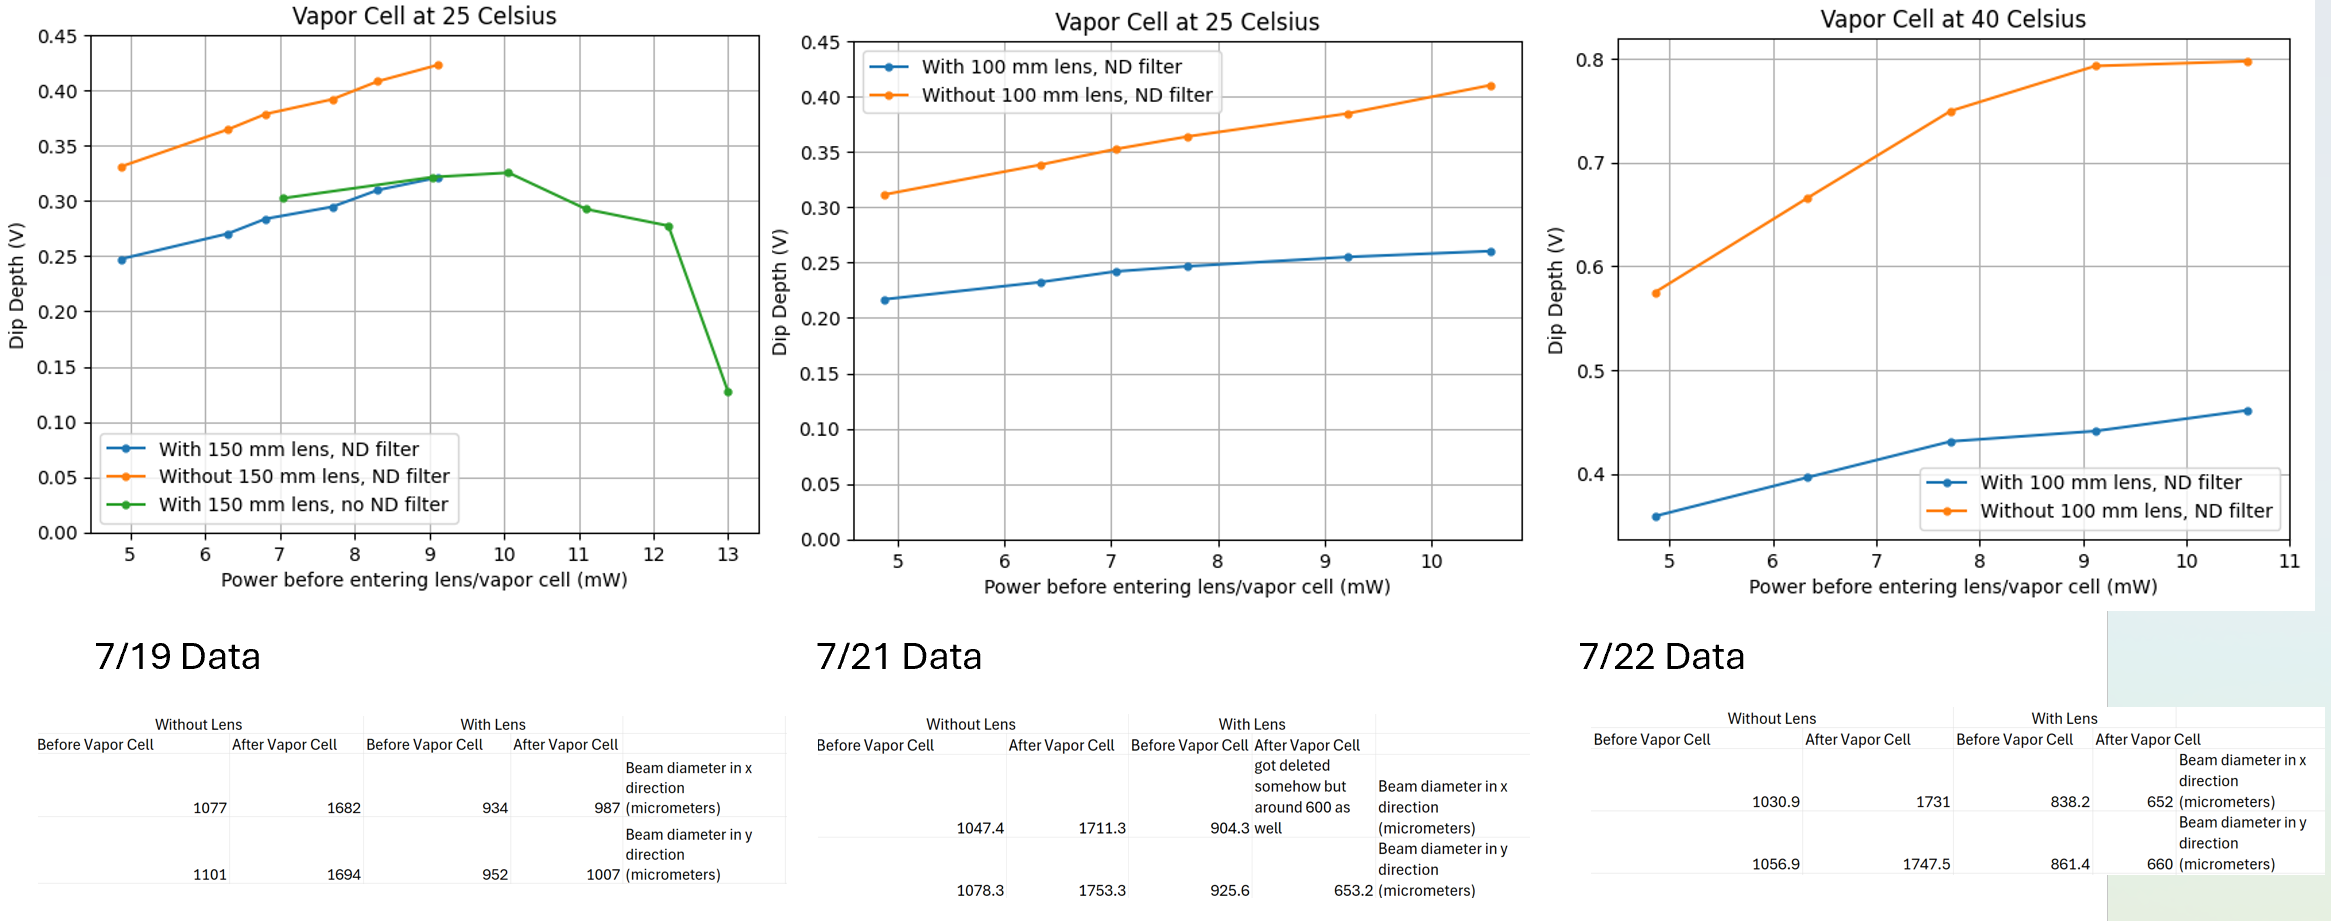
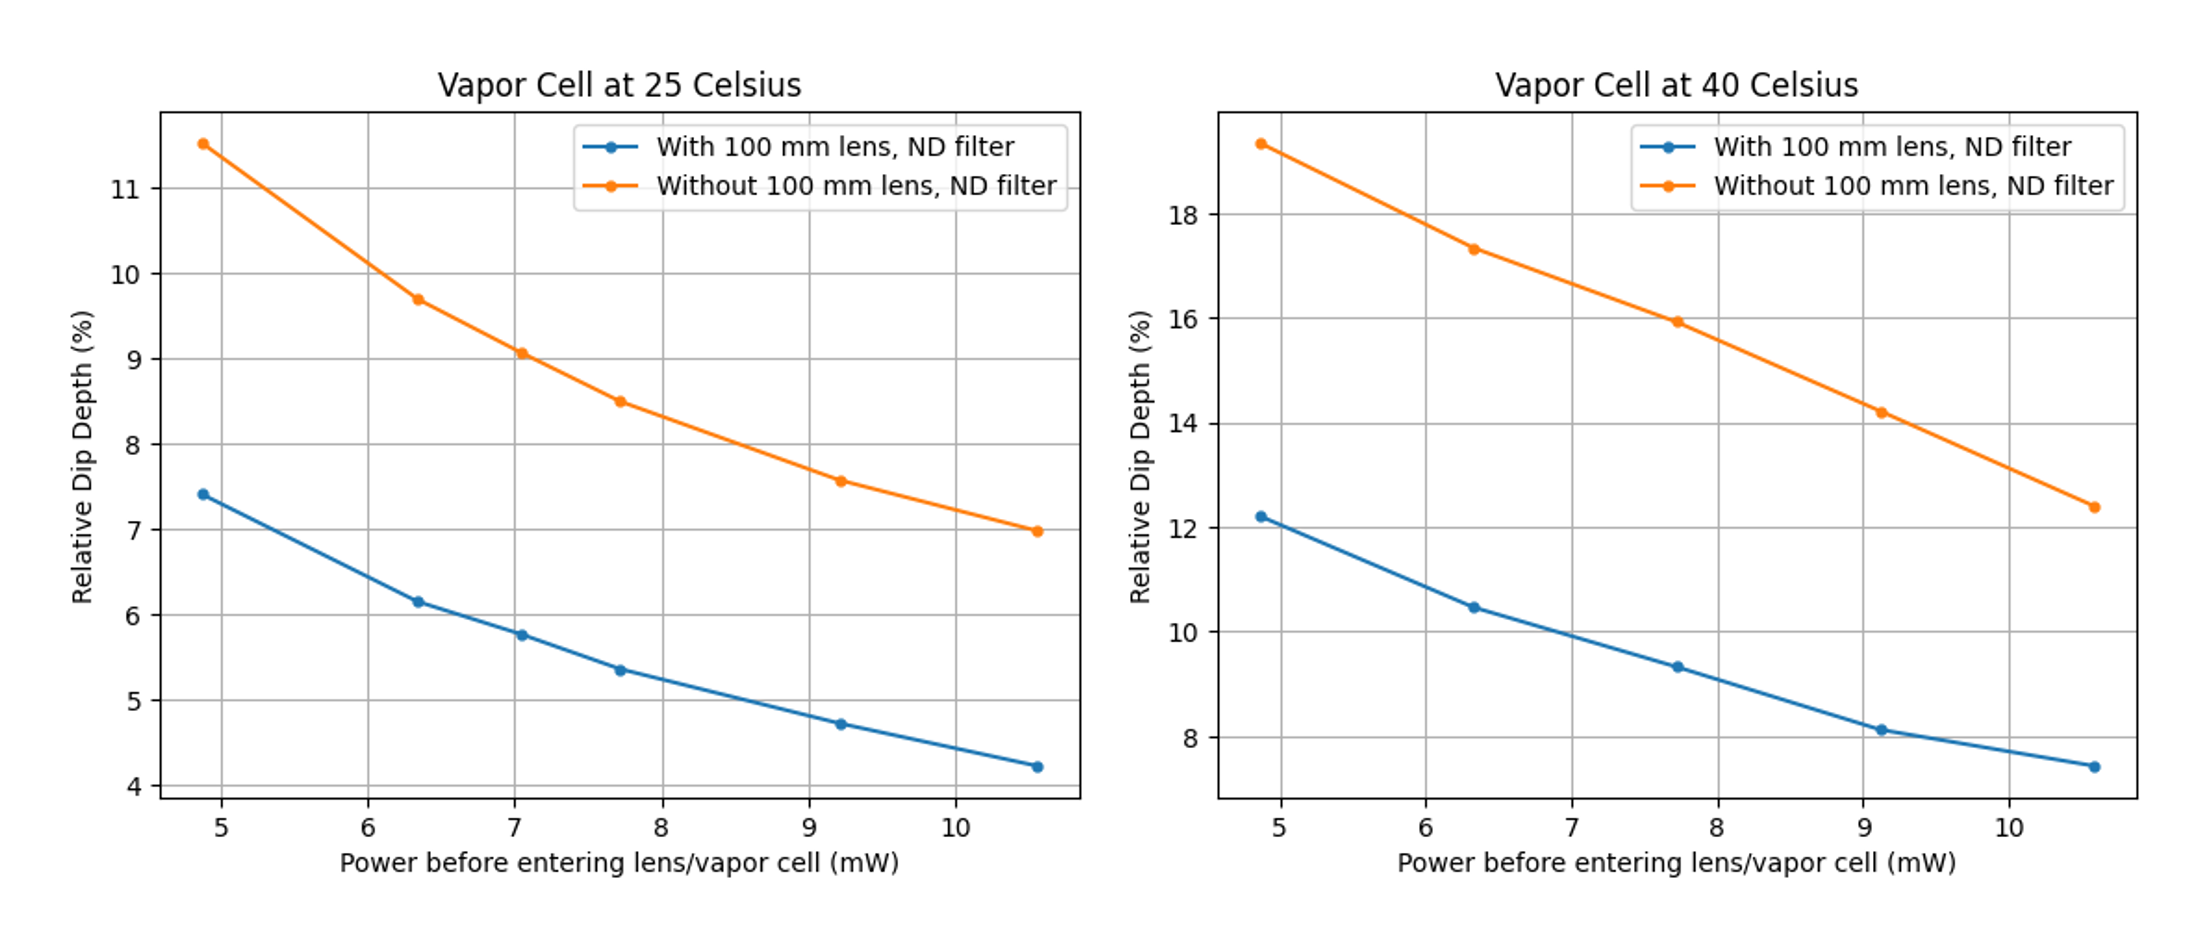
With the setup described in the last post, I took measurements for determining the dip depth with and without the 150 mm lens. The data is horrendous. I originally wanted to blame it on the beamsplitter power fluctuations but then I determined that it is a result of my changing the current. With the lens, the laser current was set to be the same, so there aren't two degrees of freedom affecting the wavelength: just temperature affects it. Legend shows the power received at the photodetector in mW. In the beginning, I did not think about this so during the no lens measurements, I changed the current from 110 to 120 to 140 mA for certain cases. Where two different powers have the dip occuring at the same temperature is where the current was at the same value. For example, the red and orange line on the left graph on the first slide of 7_24_plots corresponded to a current of 140 mA, but the others do not. All the data for the lens in place has the same applied current of 140 mA, which is why the dips all occur at the same place. How this experiment should have been done is by maintaining a constant current and purely changing the power by setting the waveplate, which isolates the laser power (without current change effects). Having the current change would have also affected dip depth. I will redo this with a constant current since this should be correct. The previous data has laser current/temperature coupled to wavelength. We'll see if the previous hypothesis that a large beam size increase the dip strength still holds (absolute or relative). I shouldn't have to modify the setup in the schematic too much, I'll just pick off the beam from the top mirror.
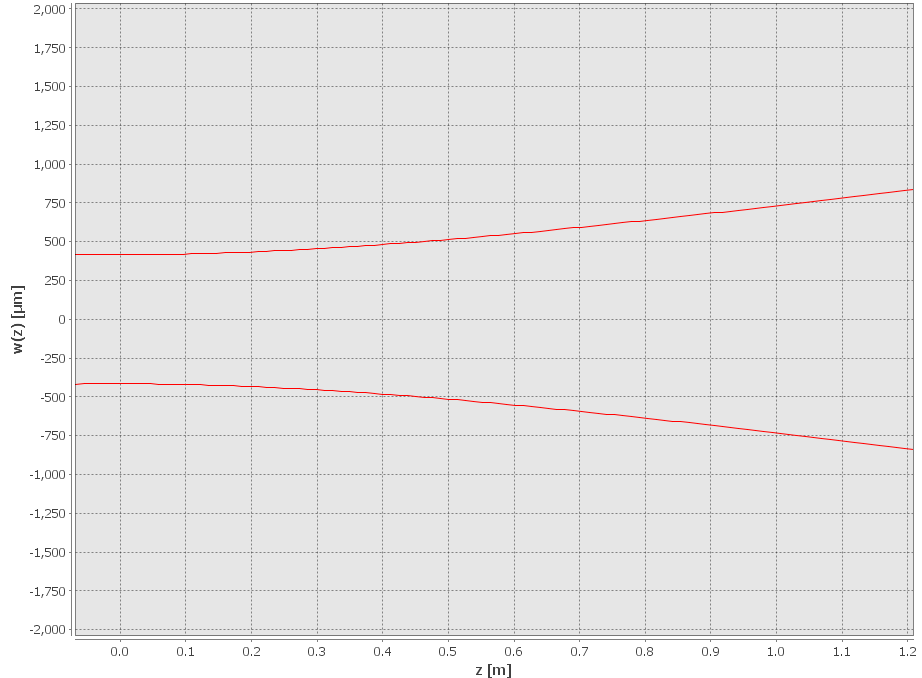
Some other notes about the experiment: I decided against using the 75 mm lens because the waist would have to appear at the end of the vapor cell (which is around 8 cm long so essentially equal to the focal length). Using JamMt, the 150 mm lens had a good difference in beam size (~870 to 181 microns going from the beginning of the vapor cell to the end with the lens, in comparison to ~1400-1500 microns without the lens). It could be useful to see what happens when the beam expands significantly, but this requires concave lenses which are not readily available.
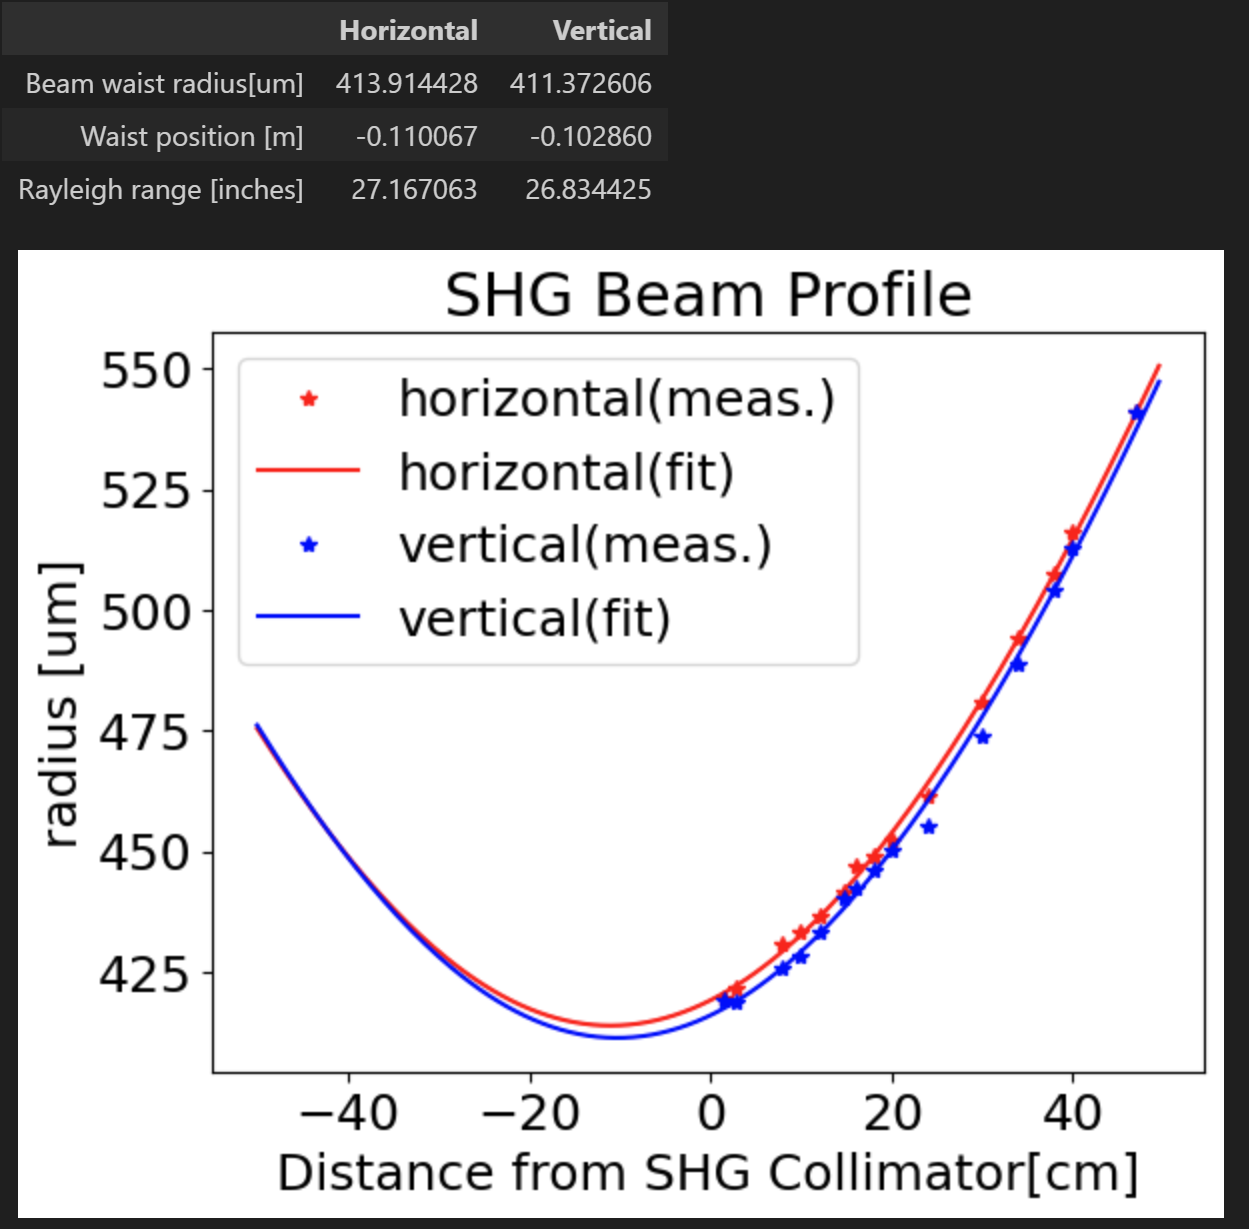
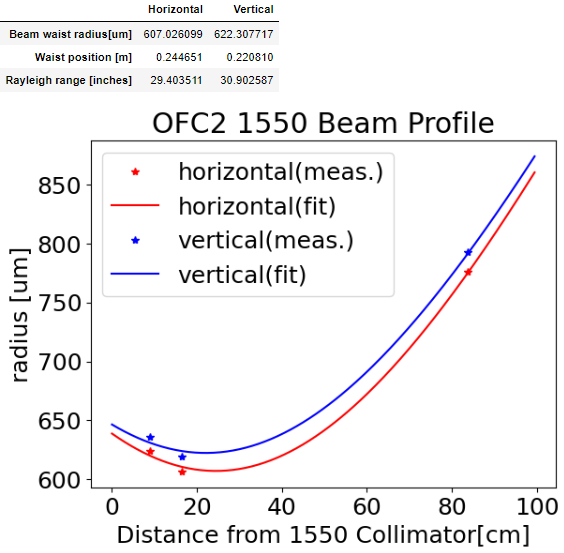
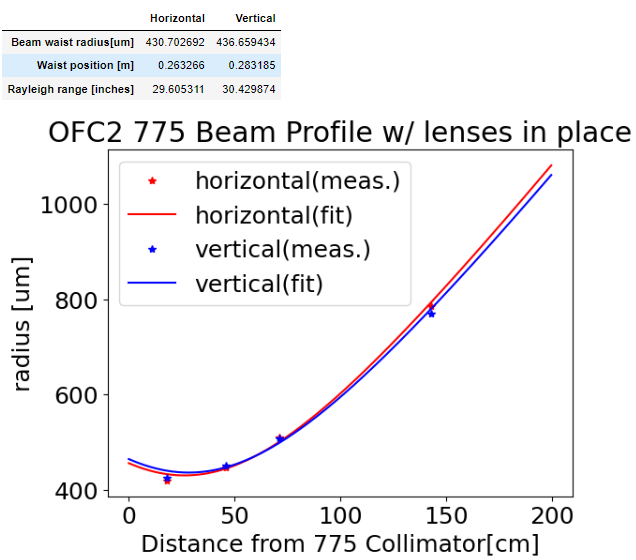
After those measurements, I moved the laser out and beam profiled it without any optics in the way along the path (108 mA, 6.762 kOhms temperature), which produced a good fit as shown here (beamprofile780). This will be used for tracking the beam through all the optics instead of beam profiling different regions. Now that we have the 780 laser beam profile, we can put the EOM in place . The beam size when entering and exiting the EOM (without any lenses) is expected to be around 1 mm from JamMt, which is more than enough for the 2 mm diameter specified by the EOM.
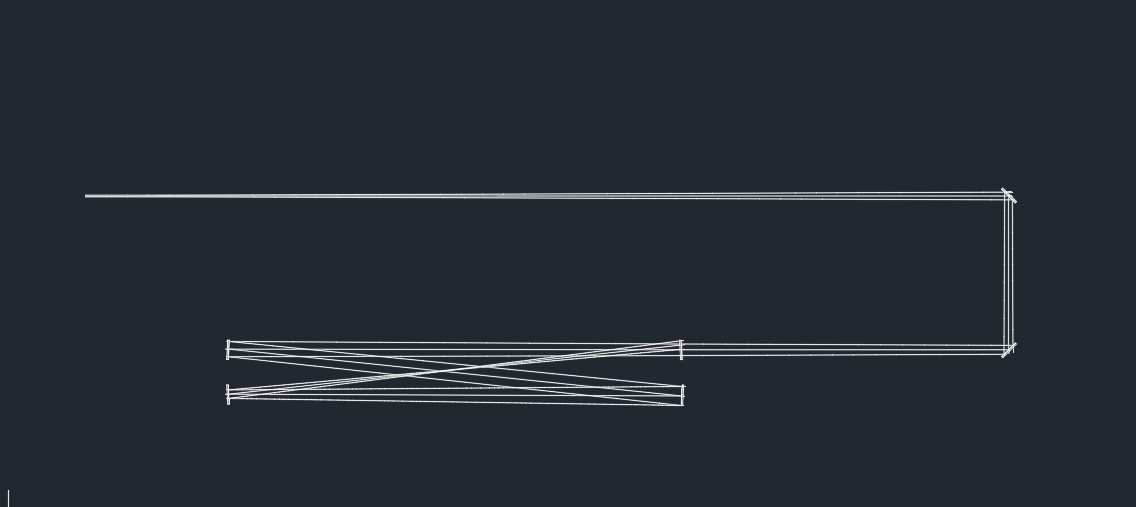
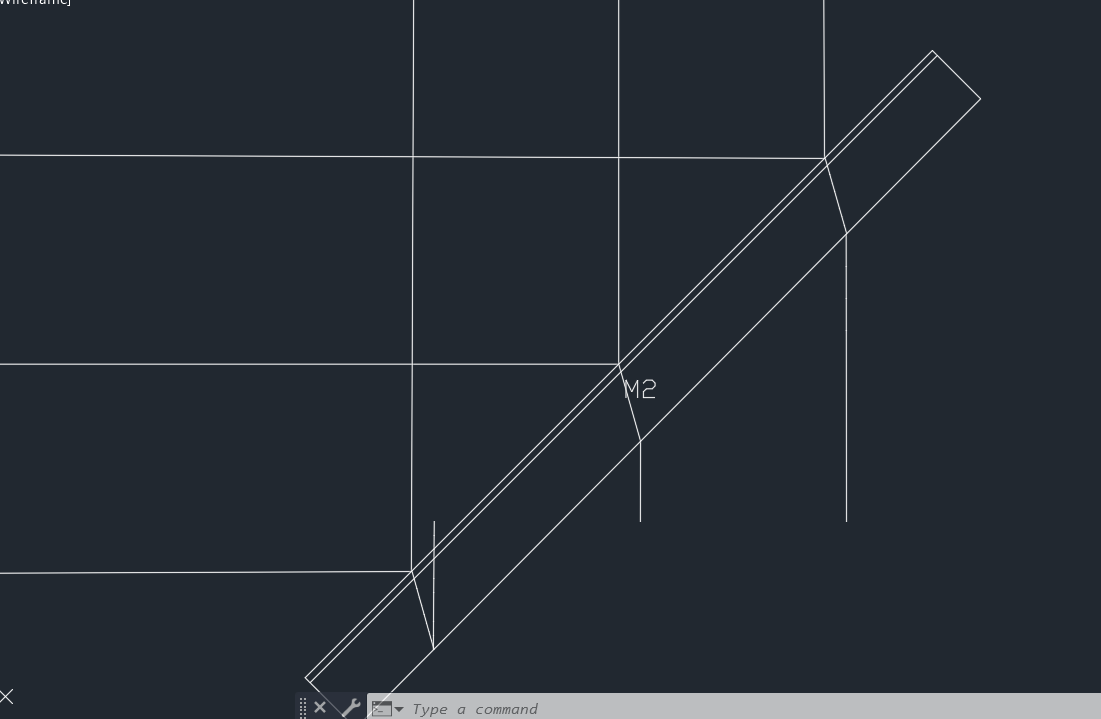
We will first put the photodetector right after the EOM to see what we read. Then, we can implement a preliminary locking with just the main absorption dip (without the pump), see tempsetup.svg for the schematic.
Recap of issues: the drift in polarization, temp controller CTRL OUT no longer reads a signal